InsightNova
vip
Age0.8Year
Peak Tier0
No content yet
#TopContentChallenge#
ETH (just a perspective): Potential Liquidity Grab Before Deeper
Price has engulfed the DP and is now pushing higher. Based on the current structure, it looks like ETH wants to hunt the liquidity resting above the $4,080 level.
The chart clearly shows ETH targeting this key liquidity zone, with a strong push likely toward the $4,200 area. This move is intended to trap late buyers and trigger stop orders sitting just above that high.
After grabbing that liquidity, we might see a sharp reversal back down toward the MPL, which sits in the $2,100–$2,500 zone. This area is a s
ETH-0.04%
post-image
  • Reward
  • 5
  • Share
AMIRA123vip:
Buy To Earn 💎
View More
#MBG任务挑战# #MBG#
mbg project and fundamental analysis – metabank global usdt pair
project overview
mbg short for metabank global is a decentralized finance infrastructure protocol that aims to bridge traditional banking and crypto by providing digital asset banking services including staking lending payment processing and web3 identity solutions built on a secure scalable blockchain mbg positions itself as a future-ready platform for digital finance
use case and utility
the mbg token plays a central role within the ecosystem it is used for transaction fees governance rewards collateral in lendin
MBG9.33%
post-image
  • Reward
  • Comment
  • Share
#MBG任务挑战# #MBG#
mbg usdt breakout strategy using ema fibonacci macd and volume for precision entries
mbg has shown explosive price action surging from 1.3372 to a high of 2.0300 within hours this move offers a textbook example of how to use technical tools to catch breakouts and manage entries effectively in a volatile market
ema5 and ema20 for trend confirmation
in the recent mbg rally the ema5 crossed above the ema20 on strong bullish candles this crossover signaled the beginning of momentum traders using this crossover with confirmation from rising price action were able to catch the bulk of
MBG9.33%
post-image
  • Reward
  • 2
  • Share
InsightNovavip:
read it carefully
View More
#Creator Campaign Phase 2# #ZKWASM#
ZKWASM 4H Chart: Fibonacci, EMA5/20 & Indicator Signals
On the 4-hour chart, ZKWASM is trading near $0.03. It recently bounced off a swing low around $0.0259 and is approaching key resistance levels. Traders often draw a Fibonacci retracement from the July peak ($0.026). These fib zones at 23.6% ($0.048) act as potential stops for the rally. In other words, if price climbs above $0.04 on strong volume, we watch for a pause near the $0.048 fib line. Cleared fib levels become support, while failure to break them can lead to pullbacks.
Moving Averages (EMA5 and
ZKWASM-3.05%
post-image
  • Reward
  • 10
  • Share
Dampezvip:
Vibras x1000 🤑
View More
#Creator Campaign Phase 2# #ZKWASM#
ZKWASM Surges 21% as zk-WASM Adoption Grows in Bullish Altcoin Market
The ZKWASM project from Delphinus Lab merges zero-knowledge proofs with WebAssembly to create a scalable, privacy-focused execution layer for decentralized applications.
Games and other dApps use this zkWASM stack to run complex logic off-chain while submitting only cryptographic proofs on-chain, cutting gas costs and preserving data confidentiality.
Architecturally, zkWASM operates in layers: transactions are sequenced and processed in an off-chain WASM VM, and a dedicated proving network
ZKWASM-3.05%
post-image
  • Reward
  • 2
  • Share
InsightNovavip:
Bull Run 🐂
View More
#ETH Hits 4800# #ETH#
Breaking the Ceiling: ETH’s Path to $4,800 in Q4 2025
As of July 28, 2025, Ethereum (ETH) is trading at approximately $3,880, reflecting modest gains of 0.3% on the day. Institutional demand remains robust: BlackRock recently increased its ETH holdings to over $10.47 billion, while SharpLink Gaming added 77,210 ETH (~$295 million) to its treasury. These cumulative purchases signal deepening confidence among major players and underscore Ethereum’s growing appeal as a long‑term asset .
Can ETH break $4,800?
Technical indicators reveal that ETH is emerging from a prolonged c
ETH-0.04%
post-image
  • Reward
  • 5
  • Share
GateUser-41929615vip:
Just go for it💪
View More
#ETH Hits 4800# #ETH#
ETH to $4800? Why I Believe the Bull Run Is Just Getting Started
Ethereum is showing strong signs that it could break through the $4800 level soon. We’ve seen ETH climb steadily from the recent low near $2300, and now it’s trading above $3700 with strong momentum. The chart is forming a clear rising channel, and ETH has been respecting all key support levels, especially the 20-day and 10-day EMAs. This is often a sign that the trend is still healthy, and buyers are not backing off yet.
But it’s not just the chart that looks strong. Ethereum has more than just price going f
ETH-0.04%
post-image
post-image
  • Reward
  • 5
  • Share
GateUser-739905devip:
Just go for it💪
View More
#Gate Square Writing Contest Phase 2# #ERA#
Inside $ERA: Price Action, Volume Traps, and the $2.20 Target
Caldera (ERA) recently spiked on listing news, then reversed. It surged ~64% intraday last week but has retraced ~30% from those highs. The all-time high was $2.002 on July 17; it now trades near $1.27. Daily volume has soared (≈$693M), confirming heavy volatility. Short-term EMAs (20, 50) are rising, reflecting a strong uptrend since mid-June, and longer-term SMA50/200 remain sloping up. However, the recent sell-off has stalled upside momentum. The daily MACD histogram is negative and RSI
ERA-1.3%
post-image
post-image
post-image
  • Reward
  • 8
  • Share
DEA_DEAvip:
👍👍👍👍👍👍👍👍
View More
#ETH Hits 4800# #ETH#
ETH to $4800? Technicals Say: It’s Not Just Hype — It’s Setup
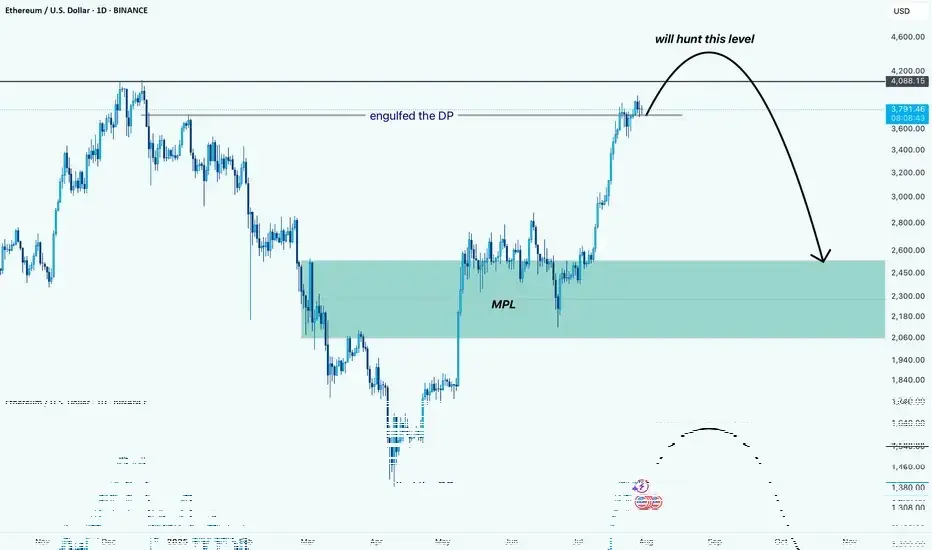
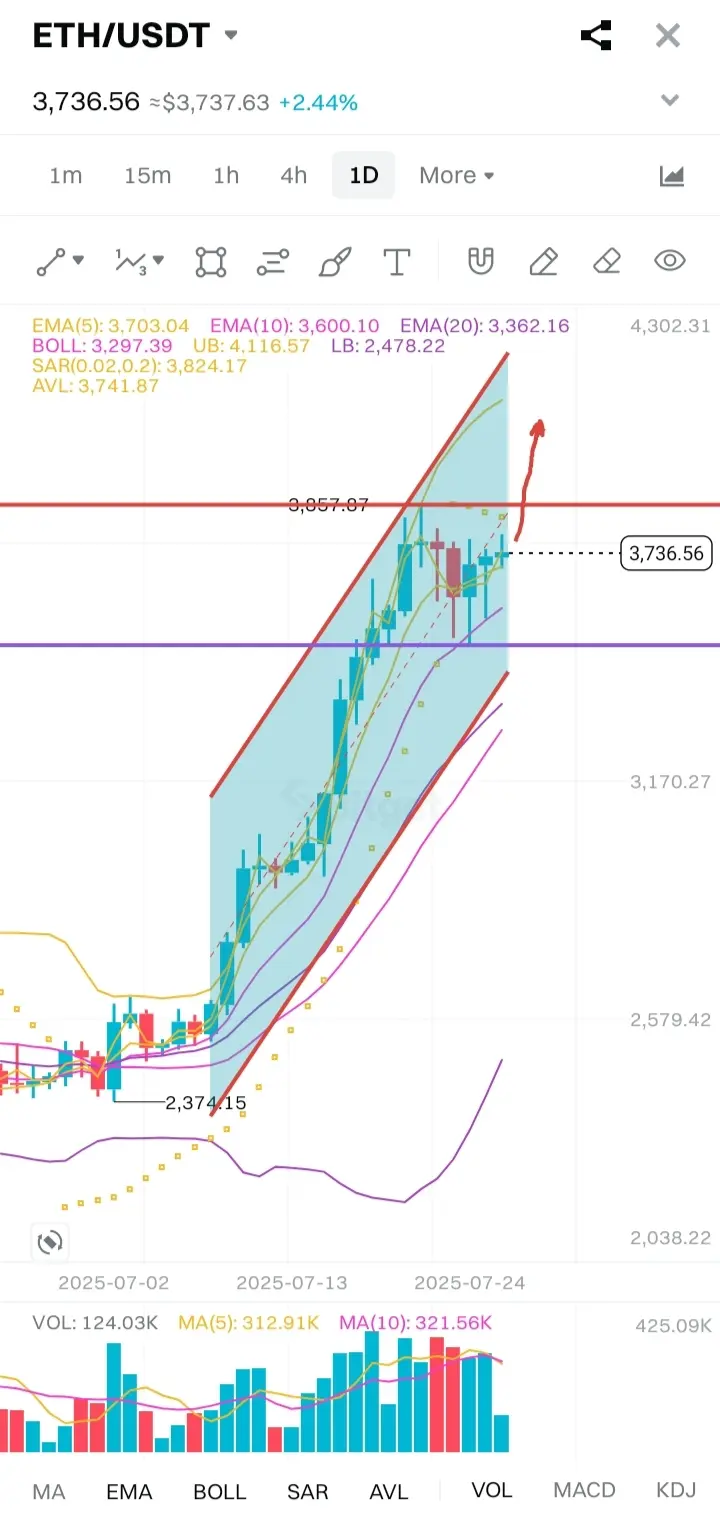
Ethereum ($ETH) is building an extremely bullish structure across multiple timeframes, and the technicals suggest a breakout beyond $4,000 could open the door toward $4,800 in the coming weeks.
Currently, ETH is trading well above all key EMAs (5, 10, 20), with EMA(10) around $3,537 and EMA(20) near $3,282—both acting as strong dynamic support. The MACD shows increasing bullish momentum, with no divergence, and the RSI hovering around 76 indicates strength, not weakness, as long as support holds.
The recent move
ETH-0.04%
  • Reward
  • 1
  • Share
InsightNovavip:
Bull Run 🐂
#Gate Square Writing Contest Phase 2# #ERA#
$ERA Caldera: Multi‑Timeframe Deep Dive—EMA/SMA, MACD, SAR, Fibonacci, Volume & Long‑Term Price Forecast
Latest Market Snapshot & Price Trend
Current ERA price sits near $1.22, down ~12% over 24h, off its ~$2.05 all‑time high reached mid‑July before retracing to ~1.20 support . Volume surged then dropped sharply, reflecting both exhaustion at the top and decline in momentum .
Moving Averages (EMA & SMA)
Short-term EMA (7-day, 21‑day): price currently below both short EMAs → bearish structure, resistance at EMA21. Needs reclaim to signal momentum shift
ERA-1.3%
post-image
  • Reward
  • 4
  • Share
Mallai_llvip:
Wow that's an amazing
View More
#Gate Square Writing Contest Phase 3#
The Role of $ESPORTS in the Multi-Game Web3 Ecosystem
Web3 gaming is evolving rapidly, and $ESPORTS stands out as a powerful token unifying players, developers, and platforms. In a multi-game ecosystem, where interoperability and shared value are essential, $ESPORTS plays a key role by connecting games, enabling cross-game economies, and rewarding active participation.
Unlike traditional games that trap players within a single environment, the $ESPORTS token allows users to move value across multiple games seamlessly. Whether it’s NFTs, game currencies, or
ESPORTS3.93%
post-image
  • Reward
  • 2
  • Share
InsightNovavip:
bull runs
View More
#Gate Square Writing Contest Phase 2# #ERA#
Era Token ($ERA) Poised for a Powerful Upswing: In-Depth Technical Breakdown & Trading Blueprint
Era Token ($ERA) has recently captured traders’ attention with its sharp 8.63% rebound from short‑term lows. After a frenetic launch that sent price as high as $2.00 before crashing to $0.03 on July 17, $ERA has stabilized in the $1.20–$1.57 range. Today’s rally to $1.386 shows that buyers are stepping back in, and a confluence of technical indicators suggests a high‑probability breakout setup.
On the upside, $ERA’s 5‑period Exponential Moving Average (EM
ERA-1.3%
post-image
  • Reward
  • 3
  • Share
InsightNovavip:
Bull Run 🐂
View More
#Gate广场征文活动第二期#
Era Token ($ERA) Poised for a Powerful Upswing: In-Depth Technical Breakdown & Trading Blueprint
Era Token ($ERA) has recently captured traders’ attention with its sharp 8.63% rebound from short‑term lows. After a frenetic launch that sent price as high as $2.00 before crashing to $0.03 on July 17, $ERA has stabilized in the $1.20–$1.57 range. Today’s rally to $1.386 shows that buyers are stepping back in, and a confluence of technical indicators suggests a high‑probability breakout setup.
On the upside, $ERA’s 5‑period Exponential Moving Average (EMA5) currently sits at $1.328
ERA-1.3%
post-image
  • Reward
  • 3
  • Share
InsightNovavip:
Bull Run 🐂
View More
#ETH# #GateSquare# #ETH冲击4800#
Ethereum ($ETH) Hits New Heights — What’s Next? A Deep-Dive Analysis (July 21, 2025)
Ethereum is making headlines again! As of today, $ETH has surged to $3,794.65, gaining +3.30% in the last 24 hours, and recently touched a 24h high of $3,824.98. With a 24h volume of 391K ETH and turnover of $1.47B USDT, Ethereum is back in the spotlight—and here’s why this rally could be far from over.
📊 Technical Analysis
EMA Momentum: The EMA(5) at $3,622.50 is soaring above EMA(10) and EMA(20), showing clear bullish momentum. This aggressive divergence between short and medi
ETH-0.04%
post-image
  • Reward
  • 3
  • Share
InsightNovavip:
Bull Run 🐂
View More
#Gate广场征文活动第二期#
ERA/USDT Technical Analysis and Forecast
The ERA/USDT market has been under pressure, dropping from a recent peak near $2.00 to about $1.246. On the 4-hour chart, short-term EMAs (5, 10, 20) have been sloping down, with the fastest EMA recently flattening out after crossing beneath the others. This hints at waning momentum in the short term. The MACD on 4h remains below zero with the signal line above the MACD line – a classic bearish alignment. However, the RSI on 4h is likely in oversold territory (well below 30), suggesting a potential bounce from near-term support. Paraboli
ERA-1.3%
post-image
  • Reward
  • 2
  • Share
InsightNovavip:
thanks for your attention
View More
#Creator Campaign Phase 1# #pumpfun#
$PUMP: Calm Before a Breakout or a Fakeout? Deep Technical Analysis Unveiled
At a current price of 0.005590 USDT, $PUMP is showing signs of potential volatility. After spiking from a low of 0.004000 to a high of 0.006150 in the last 24 hours, the market is now consolidating, up +39.75%, awaiting a breakout or rejection.
Technical Breakdown:
EMA5: 0.005578, EMA10: 0.005603, and EMA20: 0.005593
The short-term EMA5 is tightly aligned with EMA10 and EMA20, indicating a neutral to slightly bullish structure. If EMA5 crosses above EMA10 and EMA20 with momentum, w
PUMP-3.85%
  • Reward
  • 3
  • Share
InsightNovavip:
1000x Vibes 🤑
View More
#Gate Square Creator Spark Program#
TANSSI/USDT Technical Analysis: Bearish Momentum and Long-Term Outlook
Current Trend: The TANSSI price has entered a bearish phase. Short-term EMAs (5, 10, 20) are sloping down with the price below these lines, a classic sell signal. In particular, the rapid EMA-5 crossing below the longer EMAs signals falling momentum. The MACD line is likely below zero (given the sharp 21% drop), which also indicates downward momentum. Bollinger Bands have widened amid this crash, and price is hugging or breaking below the lower band. This suggests an oversold condition bu
TANSSI-3.86%
post-image
  • Reward
  • 2
  • Share
InsightNovavip:
read it carefully 💞
View More
#Gate Square Creator Spark Program#
RCADE/USDT Technical Analysis: Bearish Momentum Persists, Key Levels to Watch
Figure: RCADE/USDT 4H chart with EMA(5,10,20), SMA(5,10,20), MACD (12,26,9), Parabolic SAR and volume.
On the 4‑hour chart, RCADE is trading below its short-term moving averages, indicating recent weakness. The EMA(5) has crossed below EMA(10) and EMA(20), and the 5‑period SMA is similarly beneath the longer SMAs. In technical terms, a short-term MA crossover like EMA(5) dipping below EMA(20) is a bearish signal of falling momentum. (By contrast, had the shorter EMAs been above
RCADE-4.71%
  • Reward
  • Comment
  • Share
#Gate Square Creator Spark Program#
Tanssi (TANSSI) Price Trend & Technical Analysis: EMA, SMA, MACD, SAR, AVL Forecast & Trading Plan
Tanssi (TANSSI) is a new Ethereum-based appchain infrastructure token launched in mid‑2025. It enables developers to rapidly deploy Ethereum-secured decentralized appchains—ideal for scaling fintech, DeFi, and gaming projects. Tanssi was listed on Gate.io (Innovation Zone) in early July 2025 with major trading incentives and a HODLer airdrop. Post-listing, TANSSI surged to an all-time high (ATH) of $0.0838 on July 10, 2025, before pulling back. As of mid-July,
TANSSI-3.86%
  • Reward
  • Comment
  • Share
  • Topic
    1/3
  • Pin
Trade Crypto Anywhere Anytime
qrCode
Scan to download Gate app
Community
English
  • 简体中文
  • English
  • Tiếng Việt
  • 繁體中文
  • Español
  • Русский
  • Français (Afrique)
  • Português (Portugal)
  • Bahasa Indonesia
  • 日本語
  • بالعربية
  • Українська
  • Português (Brasil)