

- Topic
10k Popularity
204k Popularity
28k Popularity
175k Popularity
4k Popularity
- Pin
- 🎤 Cheer for Your Idol · Gate Takes You Straight to Token of Love! 🎶
Fam, head to Gate Square now and cheer for #TokenOfLove# — 20 music festival tickets are waiting for you! 🔥
HyunA / SUECO / DJ KAKA / CLICK#15 — Who are you most excited to see? Let’s cheer together!
📌 How to Join (the more ways you join, the higher your chance of winning!)
1️⃣ Interact with This Post
Like & Retweet + vote for your favorite artist
Comment: “I’m cheering for Token of Love on Gate Square!”
2️⃣ Post on Gate Square
Use hashtags: #ArtistName# + #TokenOfLove#
Post any content you like:
🎵 The song you want to he - ✈️ Gate Square | Gate Travel Sharing Event is Ongoing!
Post with #Gate Travel Sharing Ambassadors# on Square and win exclusive travel goodies! 💡
🌴 How to join:
1️⃣ Post on Square with the hashtag #Gate Travel Sharing Ambassadors#
2️⃣ You can:
Share the destination you most want to visit with Gate Travel (hidden gems or hot spots)
Tell your booking experience with Gate Travel (flights/hotels)
Drop money-saving/usage tips
Or write a light, fun Gate Travel story
📦 Prizes:
🏆 Top Ambassador (1): Gate Travel Camping Kit
🎖️ Popular Ambassadors (3): Gate Quick-Dry Travel Set
🎉 Lucky Participant - 🎉 Hey Gate Square friends! Non-stop perks and endless excitement—our hottest posting reward events are ongoing now! The more you post, the more you win. Don’t miss your exclusive goodies! 🚀
🆘 #Gate 2025 Semi-Year Community Gala# | Square Content Creator TOP 10
Only 1 day left! Your favorite creator is one vote away from TOP 10. Interact on Square to earn Votes—boost them and enter the prize draw. Prizes: iPhone 16 Pro Max, Golden Bull sculpture, Futures Vouchers!
Details 👉 https://www.gate.com/activities/community-vote
1️⃣ #Show My Alpha Points# | Share your Alpha points & gains
Post your
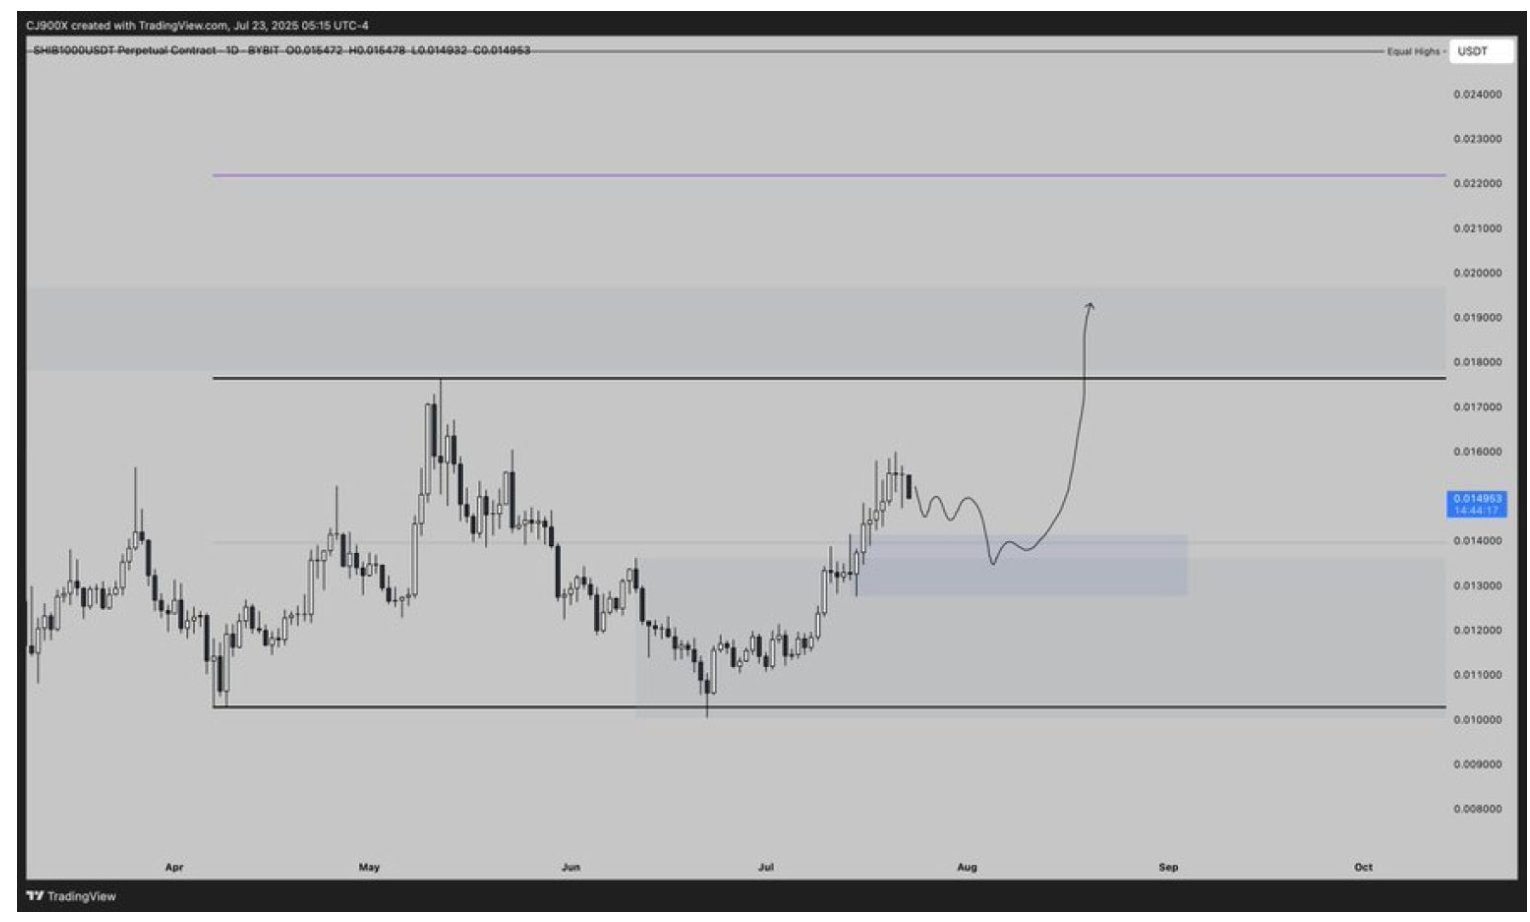
Shiba Inu (SHIB) Price Prediction: Analysts Warn of 0.0000128 USD long positions Defense Line with Potential Rebound Space Exceeding 34%
Shiba Inu(SHIB)has fallen 11% to $0.000013483 in the past 24 hours, but well-known analyst CJ points out that it has currently entered the "middle band demand zone"(0.0000142-0.0000128), which may present an excellent opportunity for long positions. The technical aspect shows that SHIB has been oscillating in the trading range of $0.00001004-$0.00001764 for nearly five months, and it has currently retreated to the middle band of the range. If it holds the support at $0.0000128, it is expected to initiate a rebound towards the upper band of $0.00001764, with a breakthrough aiming at a target of $0.0000190 (+34%). The on-chain chip distribution suggests higher targets of $0.000024-$0.000035.
Key support area: last line of defense for long positions
The trading range oscillation pattern: has not broken for five months
Rebound Path and Target Calculation
** **
**
Operation Strategies and Risk Control Points
on-chain data verification
Conclusion: SHIB has currently fallen to the middle band of a five-month trading range, with both technical indicators and on-chain data indicating strong support in the $0.0000142-$0.0000128 region. Analyst CJ's "demand zone" theory requires two main conditions: 1) it must not fall below $0.0000128; 2) the rebound must break through the $0.0000150 mid-axis pressure with volume. If the pattern is established, the first target is $0.00001764 (+27%), and if it breaks through, we look at $0.000019 (+34%). Given the characteristics of meme coins, investors must strictly adhere to the stop-loss line at $0.0000128 to guard against the risk of falling to the $0.00001004 bottom of the trading range after a breakdown.