How to Use NAV to Assess How Much Your Crypto Stocks Are Worth
Repost of the original article: “A Layman’s Guide: How to Use NAV to Value Your Crypto Stocks”
It’s clear that the latest crypto bull market began with U.S. equities.
As “crypto treasury reserve strategies” have become increasingly popular on Wall Street and crypto and stocks move in sync, how should investors assess the quality of a stock? Should we focus on which company holds the most crypto assets, or which one continually increases its crypto reserves?
If you’ve been following U.S. crypto stock analysis recently, you’ve likely encountered a recurring term—NAV, or Net Asset Value.

Some market observers use NAV to determine if a crypto stock is overvalued or undervalued. Others use the figure to compare the share prices of new crypto treasury companies to MicroStrategy’s. The real wealth-building insight lies here:
For a publicly traded U.S. company implementing a crypto reserve strategy, each $1 in crypto it holds can be worth more than $1 to shareholders.
Such companies can continue to accumulate digital assets or repurchase their own stock, often pushing their market capitalization far above their net asset value (NAV).
Yet for most retail investors, the majority of crypto projects rarely use rigorous financial metrics to measure value—let alone apply them to stocks in the traditional capital markets.
That’s why this article aims to introduce the basics of NAV, helping investors focused on crypto-equity convergence better understand how these companies operate and how to evaluate them.
NAV: What’s Your Stock Really Worth?
The following section clarifies the basics.
NAV isn’t exclusive to crypto. It’s a cornerstone metric in traditional financial analysis, designed to answer a straightforward question:
“What is the true value per share of a company?”
To calculate NAV, subtract the company’s liabilities from its assets, and then divide the result by the number of shares outstanding. This gives you the net value per share available to shareholders.

Consider the following real-world example. Suppose a real estate company owns:
Assets: 10 buildings with a combined value of $1 billion; Liabilities: $200 million in loans; Shares outstanding: 100 million.
The company’s NAV per share is $80. This means that, if the company liquidated all assets and settled its debts, each shareholder would theoretically receive $80 per share.
NAV is a flexible and widely used financial metric, especially for asset-heavy businesses like real estate or investment funds, where asset values are transparent and relatively easy to appraise. This makes NAV a reliable gauge of a stock’s intrinsic value.
Traditionally, investors compare NAV with the stock’s current market price to determine whether the share is overvalued or undervalued:
- If share price > NAV: The stock is trading at a premium, suggesting strong investor confidence in its future growth.
- If share price < NAV: The stock may be undervalued, reflecting skepticism or uncertainty about the company’s assets.
But when it comes to U.S. stocks with crypto exposure, the meaning of NAV shifts.
Within the crypto equity space, NAV is chiefly used to:
Evaluate how a public company’s crypto holdings impact its stock value.
Here, NAV extends beyond the classic “assets minus liabilities” formula by explicitly incorporating the company’s crypto asset values. Since crypto asset prices are highly volatile, NAV for these companies can fluctuate rapidly—and so can their share prices.
For companies such as MicroStrategy, NAV calculations are dominated by the value of their Bitcoin holdings, which make up the bulk of their total assets.
This slightly modifies the basic NAV formula:

When crypto assets are included in NAV, consider these critical changes:
- Greater NAV volatility: By their nature, crypto prices can swing dramatically, so NAV becomes much more volatile than it is for traditional asset classes.
- NAV premium effect driven by crypto: Crypto holdings can create a market premium—investors pay above book value in anticipation of asset appreciation. For example, a company holding $100 million in Bitcoin may see a market capitalization of $200 million, reflecting bullish expectations.
If the market expects Bitcoin’s price to rise, investors will price that optimism into shares, assigning a premium over NAV. Conversely, when sentiment sours, NAV will offer less guidance for valuation.
To further clarify NAV, consider the following example involving MicroStrategy.

As of this writing (July 22), public data shows MicroStrategy holds 607,770 BTC, valued at $117,903 per coin—a total crypto reserve of roughly $72 billion. The company’s other assets total about $100 million, with $8.2 billion in liabilities.
With around 260 million shares outstanding, MicroStrategy’s NAV is about $248 per share. That means, based on its BTC treasury, each share should be worth approximately $248.
Yet, on the most recent trading day, its actual share price was $426.
This difference reflects a market premium: investors are pricing in future gains in Bitcoin, pushing the share price above NAV.
Such a premium illustrates how NAV cannot fully account for market sentiment toward crypto assets.
mNAV: A Market Sentiment Barometer for Crypto Stocks
In addition to NAV, analysts and key opinion leaders often cite another relevant metric: mNAV.
If NAV is the baseline indicator of share value, mNAV is a more responsive tool designed for the fast-moving crypto market.
As discussed, NAV highlights the company’s current net asset position (primarily its crypto reserves), not investor expectations. mNAV, by contrast, is market-oriented—it measures the relationship between a company’s market capitalization and its net crypto asset value. The formula is as follows:

Here, “net crypto asset value” equals the company’s crypto holdings minus any relevant liabilities.
The comparative table below highlights the key differences:
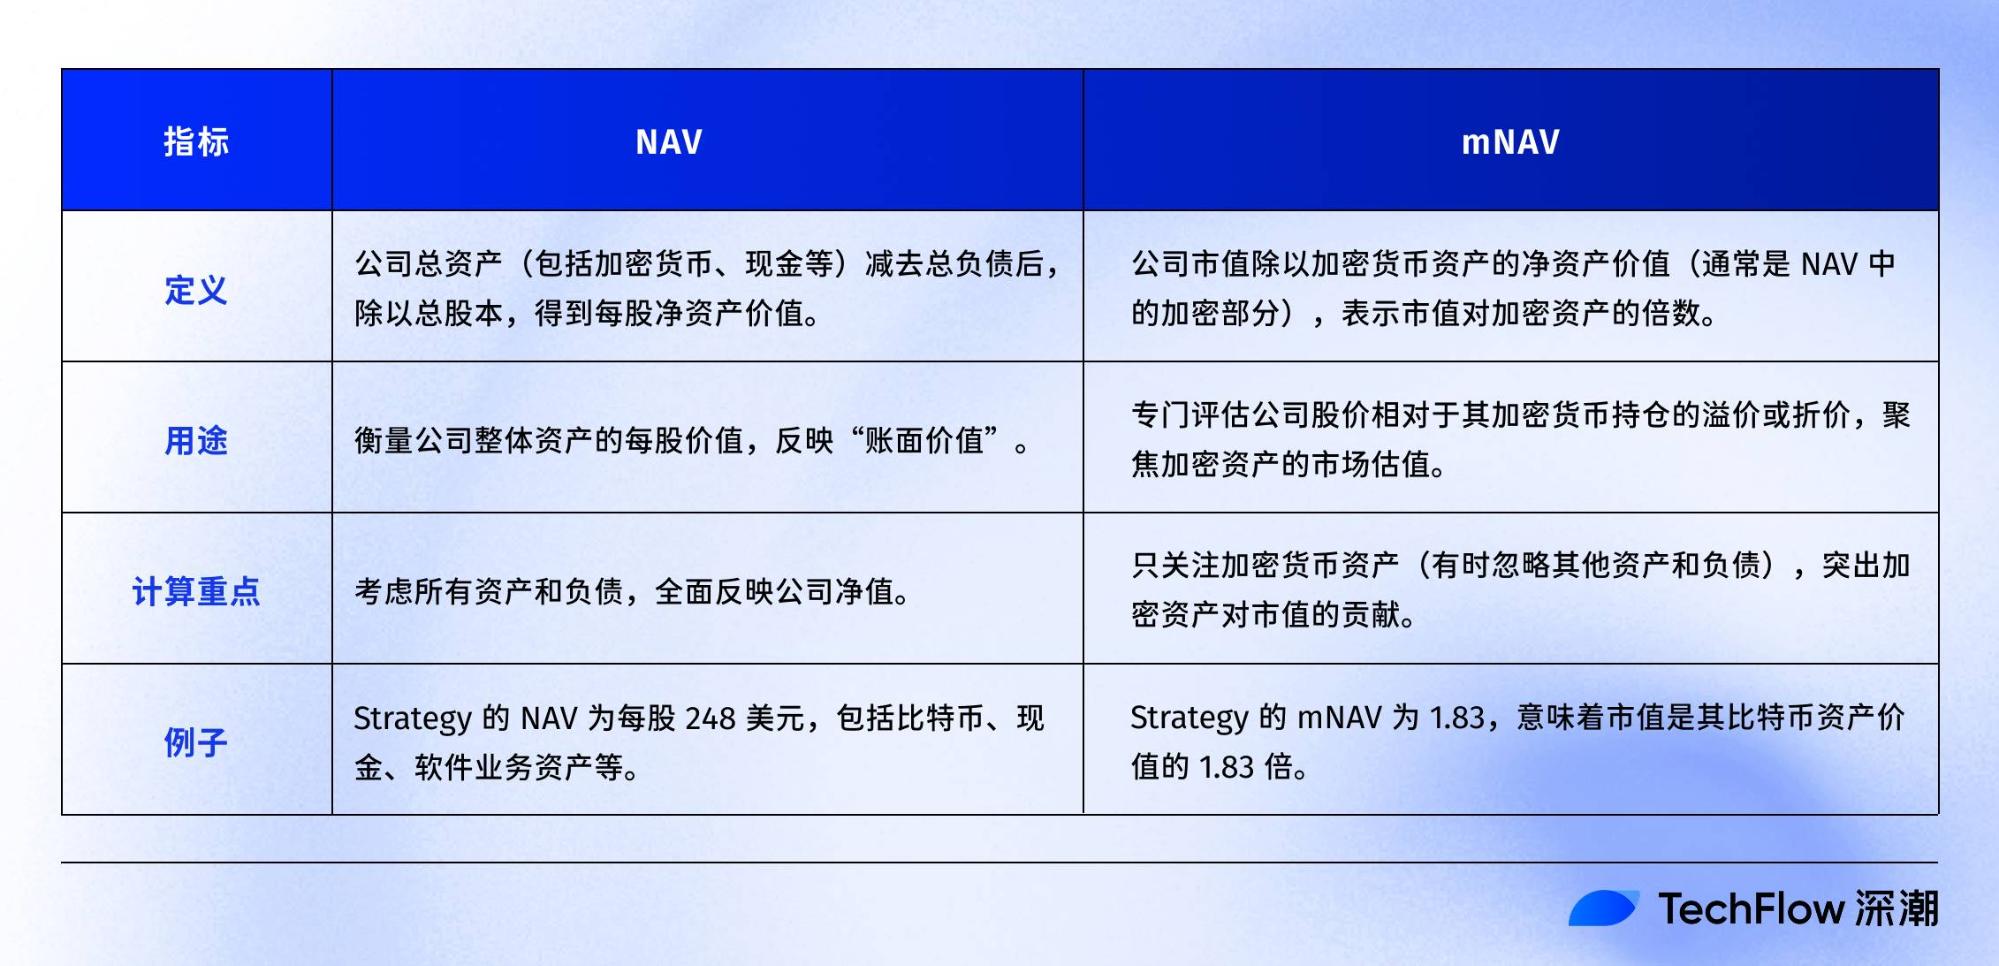
Based on prior calculations, MicroStrategy’s total market capitalization stands at roughly $120 billion, while its net crypto assets (crypto plus other assets, minus liabilities) amount to about $63.5 billion. Therefore, its mNAV is approximately 1.83.
In practical terms, MicroStrategy’s market capitalization is 1.83 times its net Bitcoin holdings.
As companies hold more crypto, mNAV becomes a more accurate gauge of market expectations, revealing whether the company’s crypto assets trade at a market premium or discount. As in our example, MicroStrategy’s share price is priced 1.83 times above its net crypto assets.
For short-term traders watching sentiment, mNAV is a more sensitive reference point:
When Bitcoin rises, bullish sentiment toward crypto-exposed firms often sends share prices above NAV, as captured by a high mNAV.
mNAV > 1 signals a market premium on the company’s crypto reserves; mNAV < 1 points to weak investor confidence.
Premiums, Reflexivity Flywheels, and Death Spirals
As noted, MicroStrategy’s mNAV is currently around 1.83.
With ETH increasingly held by U.S. listed companies, understanding their mNAV provides a valuable way to assess whether crypto equities are over- or undervalued.
Cycle Trading analyst @Jadennn326eth recently compiled a comprehensive chart showing the asset-liability structures and mNAV values of major ETH-holding firms (data as of last week).

(Source: @Jadennn326eth, Cycle Trading)
This comparative chart highlights the distribution of value among ETH-reserve companies in 2025’s crypto-stock market:
BMNR leads the pack with a sky-high mNAV of 6.98, its market capitalization far outstripping its ETH holdings—hinting at a potential bubble. If ETH falls, its share price would be among the first hit. BTCS, with an mNAV of 1.53, is trading at a much smaller market premium.
With this data in hand, the following section discusses the “Reflexivity Flywheel.”
This concept, developed from George Soros’s theory of reflexivity, serves as a key driver behind runaway share price rallies in the 2025 crypto bull market.
In essence, a reflexivity flywheel is a positive feedback loop: a company raises capital by issuing shares or via at-the-market (ATM) offerings, uses the proceeds to buy ETH, boosting its NAV and mNAV. This attracts more investor demand and pushes the share price higher. This, in turn, makes further capital raises easier and enables ever-larger crypto purchases—a self-reinforcing “snowball” cycle.

If ETH prices drop, regulatory scrutiny intensifies (such as the SEC reviewing crypto reserve strategies), or funding costs spike, the flywheel can suddenly reverse into a death spiral: share prices collapse, mNAV plummets, and investors may suffer significant losses.
Bottom line:
NAV and similar metrics are not comprehensive solutions, but they are essential tools for market analysis.
To navigate the risks and opportunities of crypto-equity convergence, investors should combine these indicators with macro trends in major crypto assets, company leverage, and growth rates—so they can find opportunities in an environment that appears full of promise, but carries substantial risk.
Disclaimer:
- This article is a repost from [TechFlow] titled “A Layman’s Guide: How to Use NAV to Value Your Crypto Stocks.” All copyrights belong to the original author [TechFlow]. For any concerns regarding this repost, please contact the Gate Learn team; we will address your request promptly in line with our established procedures.
- Disclaimer: The opinions expressed in this article are solely those of the author and do not constitute investment advice.
- All non-English versions are translated by the Gate Learn team. No reproduction, distribution, or plagiarism of these translations is allowed without reference to Gate.
Related articles

Solana Need L2s And Appchains?

Sui: How are users leveraging its speed, security, & scalability?

The Future of Cross-Chain Bridges: Full-Chain Interoperability Becomes Inevitable, Liquidity Bridges Will Decline

What Is Ethereum 2.0? Understanding The Merge

Navigating the Zero Knowledge Landscape
