Gate Research: ETH Climbs Strongly, CROSS Surges Over 470%, Sparking a Mid-Cap Rotation Rally
Crypto Market Overview
According to CoinGecko data, from July 8 to July 21, 2025, the cryptocurrency market saw a strong upward trend, with a significant increase in total market capitalization. Most major crypto assets recorded double-digit gains. BTC broke through its previous all-time high and continued to trend steadily within an ascending channel, while ETH also maintained a bullish structure with sustained upward momentum.【1】
Meanwhile, on July 17, the U.S. House of Representatives unanimously passed three major crypto-related legislative proposals: the CLARITY Act, the GENIUS Act, and the Anti-CBDC Surveillance State Act, further strengthening the regulatory framework for digital assets. Among them, the GENIUS Act has already been signed into law by the President, marking the first federal-level crypto legislation in the United States. It mandates that all stablecoins must be fully backed by 100% reserve assets and undergo annual audits, establishing a unified regulatory standard. The SEC also announced plans to introduce a tokenization exemption mechanism to encourage innovation.
Overall, with both favorable policy developments and a strong technical uptrend, the crypto market experienced a notable rally over the past two weeks. Major assets like BTC and ETH achieved significant breakouts, while overall market capitalization surged and investor confidence visibly recovered. The enactment of these three key bills provides clear regulatory guidance on stablecoin oversight, asset classification, and anti-CBDC positioning, potentially attracting more institutional and compliant capital into the space. With clearer policies and a more robust market structure, the crypto market is advancing toward a healthier and more sustainable phase of development.
1. Overview of Price Performance
This report analyzes the performance of the top 500 cryptocurrencies by market capitalization, grouped in segments of 100, to observe the average price increase across different market cap ranges from July 8 to July 21, 2025.
Overall, the crypto market exhibited a relatively balanced yet slightly structural upward trend. The average gain across all top 500 tokens ranged between 28% and 32%, indicating a broad-based rally with clear signs of renewed investor confidence.
Tokens ranked 101–200 and 401–500 performed the best, with average gains exceeding 32%, suggesting that capital actively sought breakout potential in mid-to-lower-tier assets rather than concentrating solely on top-cap coins. Tokens ranked 1–100 and 201–300 recorded steady average gains of around 30%, while those ranked 301–400 slightly underperformed with an average gain of 29%. Nevertheless, all groups remained in an upward trajectory.
This round of market movement reflects a more balanced capital rotation, benefiting both large-cap and mid/small-cap assets. The rally was no longer driven by a single narrative but evolved toward a more diversified and broadly distributed structure. The gain distribution suggests a market transition—from an institution-led trend in major assets to a new phase characterized by sector rotations and individual token outperformance—laying a solid foundation for continued growth.
Note: Market cap data is based on CoinGecko. The top 500 tokens were divided into five groups of 100 (e.g., ranks 1–100, 101–200, etc.). Each group’s average price change during the period from July 8 to July 21, 2025, was calculated to represent the average return of that market cap segment. The overall average return of 31.28% is a simple average of individual token gains, without weighting.
Figure 1: The overall average return was 31.28%, with tokens ranked 101–200 leading the gains at nearly 33%.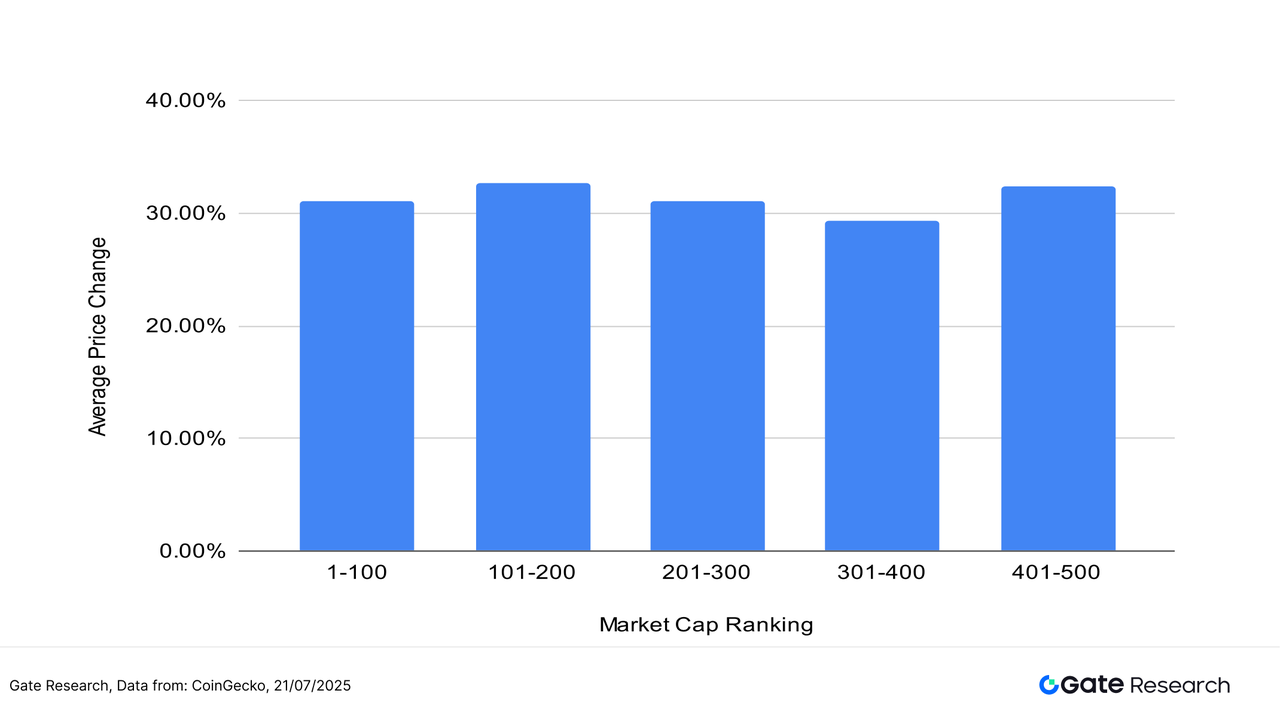
Top Gainers and Losers
Over the past two weeks, the cryptocurrency market has seen a broad upward trend with active capital rotation and clear structural divergence. Several small-cap, high-volatility assets delivered standout performances. The top ten gainers were predominantly from the Meme, AI, Layer 1, or emerging community-driven sectors—areas characterized by strong narratives and speculative appeal, making them focal points for short-term capital.
Among the top performers, all top ten tokens posted gains exceeding 100%, with most concentrated in Meme coins, Layer 1 ecosystems, and experimental projects. CROSS led the pack with a remarkable 476.45% surge. Designed specifically for gaming, CROSS is an EVM-compatible Layer 1 blockchain offering modular infrastructure such as SDKs, DEXs, bridges, and wallets to support Web3 game development. Its native token, CROSS, is used for gas fees, governance, and staking, and has a fixed supply cap. The token’s recent listings on multiple exchanges have significantly boosted its visibility and capital inflows.
Other notable gainers included CFX (+197.72%) and DIA (+162.52%), benefiting from renewed interest in Layer 1 narratives and the oracle sector, respectively. Tokens such as M, SNEK, PENGU, and WEMIX attracted speculative attention due to community-driven hype and high-beta appeal. Legacy assets like XTZ and BLACK, as well as mid-cap narrative tokens like PTGC, also saw significant gains, each exceeding 100%.
On the other hand, losses were relatively mild. The top decliner was PUMP (-20.18%), likely due to post-ICO profit-taking as the initial hype faded—demonstrating typical selling pressure after presale peaks. Most losers saw declines between -3% and -18%, suggesting that while the market remains broadly bullish, some tokens faced temporary pullbacks due to waning interest, limited liquidity, or lack of new narratives. SYRUP, VRSC, SQD, and AIC led the decliner list, mostly representing lower-cap projects with exhausted momentum or limited community traction.
This rally was driven primarily by high-narrative tokens with strong listing catalysts and technical potential. CROSS, as a gaming-centric EVM-compatible chain, gained particular attention after announcing an exclusive partnership with AI game-generation platform Verse8. The collaboration enables users to create games via text prompts and issue related tokens and NFTs directly on CROSS, reinforcing its positioning as a Web3 gaming infrastructure layer.
Overall, capital flows remain focused on tokens with strong narratives, vibrant communities, and real-world utility prospects. Meanwhile, tokens lacking liquidity or compelling stories continue to be sidelined. This structural rotation trend is likely to persist.【2】
Figure 2: The standout performer was CROSS, a gaming-focused L1 that surged 476% in two weeks, driven by new exchange listings and ecosystem partnerships.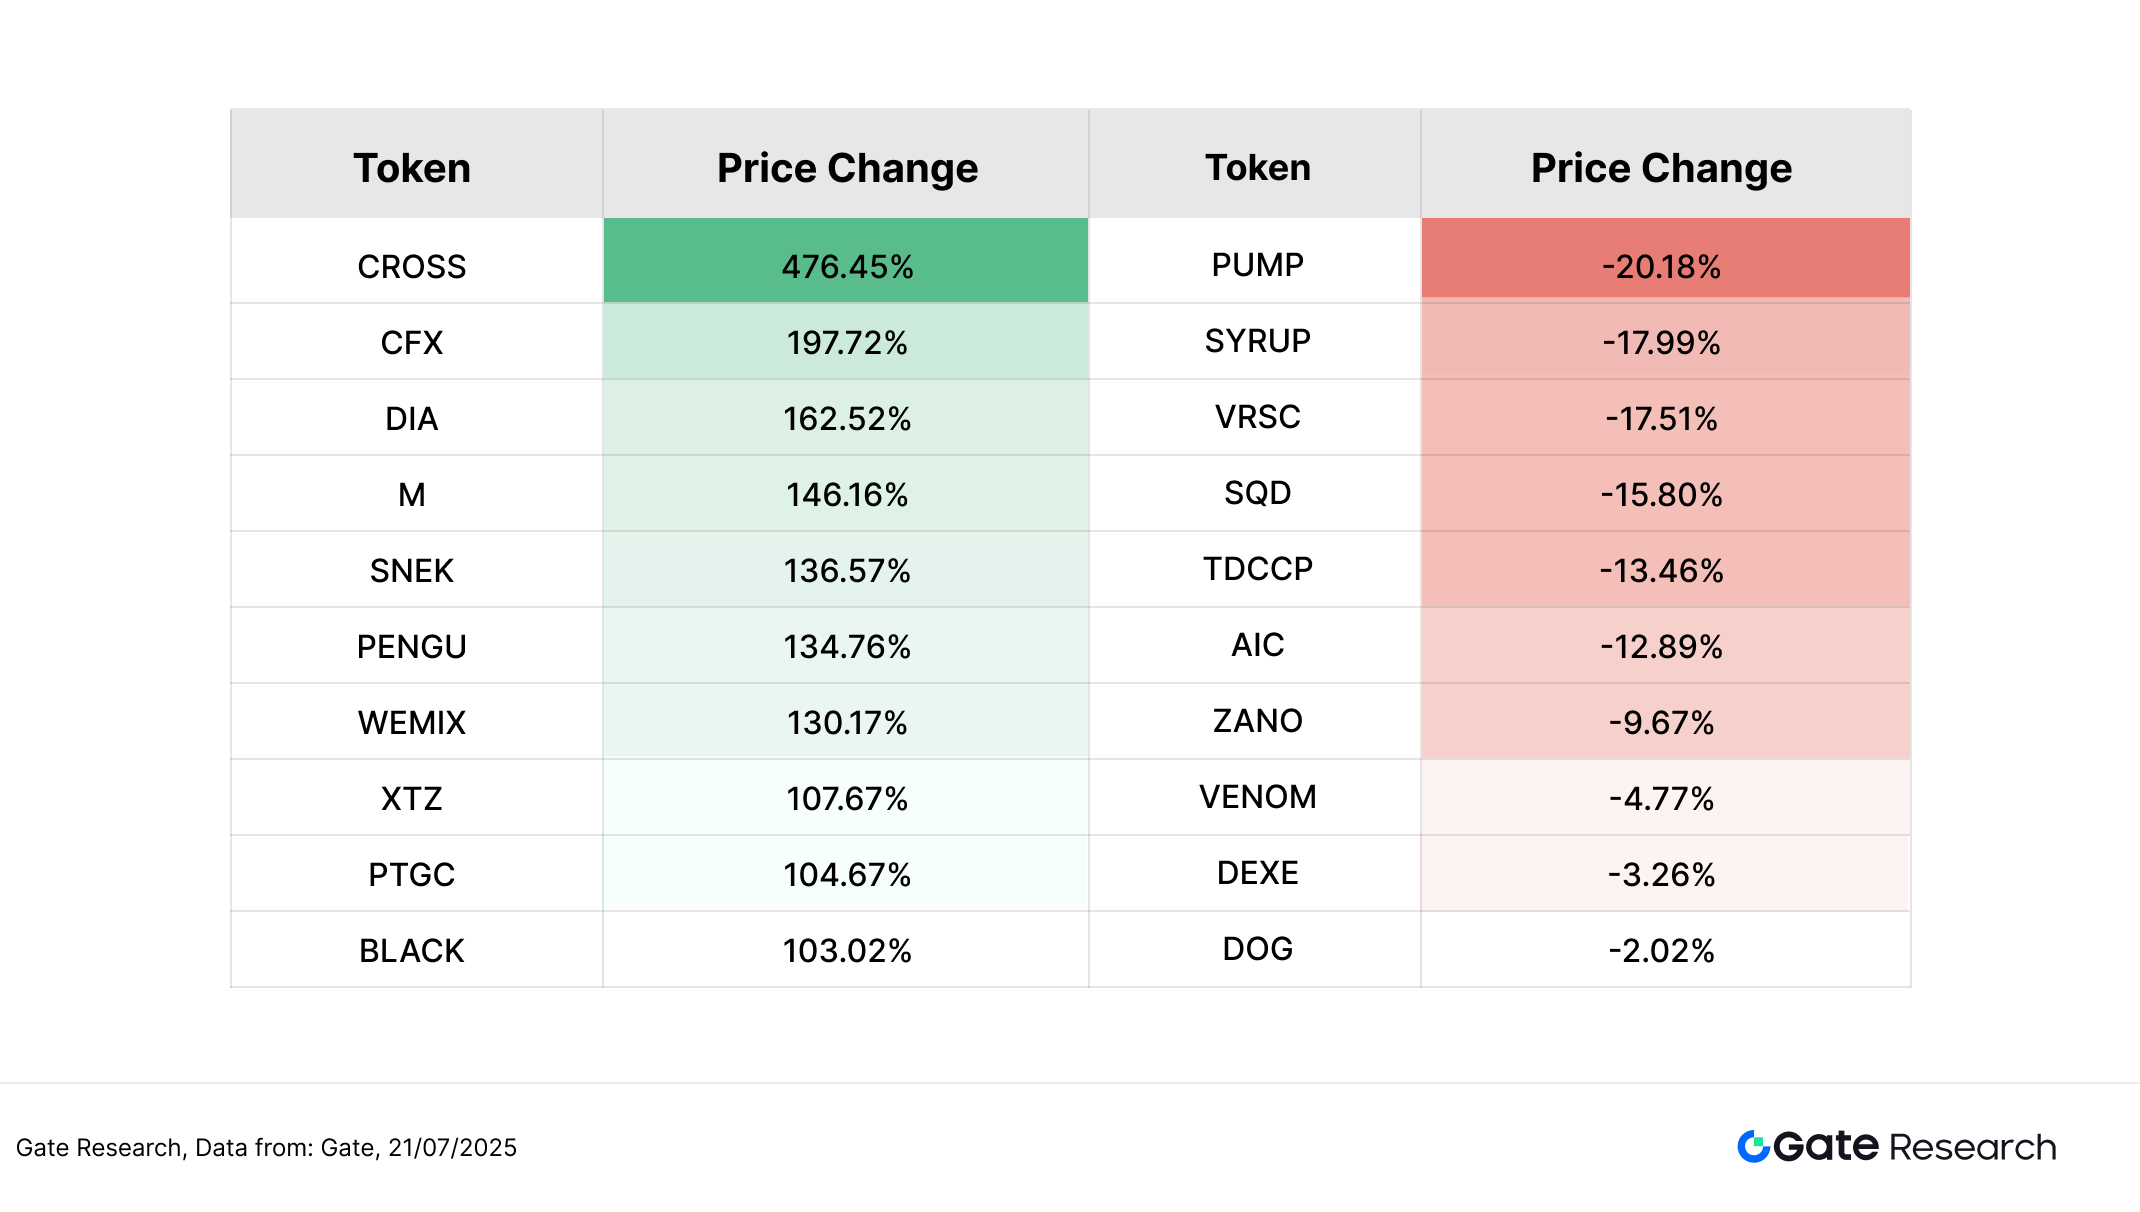
Relationship Between Market Cap Ranking and Price Performance
To further analyze the structural characteristics of token performance during this market rally, we present a scatter plot of the top 500 tokens by market capitalization. The x-axis represents market cap ranking (with lower ranks indicating higher market caps), while the y-axis shows the percentage change in price from July 8 to July 21, displayed on a logarithmic scale. Each dot on the chart represents a token, with green indicating a gain and red indicating a loss.
From the overall distribution, more than half of the tokens recorded price increases, with gains largely concentrated in the 30–80% range. This suggests that while market sentiment has improved, it has not yet entered a full-scale bull phase. The strongest performers were primarily mid- to small-cap assets, particularly tokens like CROSS, DIA, BLACK, CFX, and PENGU, which appear at the upper end of the chart. These gains reflect a clear market preference for high-beta tokens backed by compelling narratives, ecosystem momentum, or exchange listing catalysts. CROSS, which surged by 476%, was the top performer in this round, benefiting from multiple exchange listings and a partnership with the AI gaming platform Verse8.
Overall, tokens in the mid-to-lower market cap range were more active, underscoring a strong rotation trend. In contrast, the biggest losers were mostly tokens that lacked strong narratives or suffered from waning interest. Tokens such as PUMP, SYRUP, VRSC, and SQD experienced relatively sharp declines, often due to fading hype or weak liquidity—making them more vulnerable in a volatile market.
Figure 3: More than half of the top 500 tokens posted gains, with capital favoring mid- to small-cap projects featuring strong narratives and high volatility. CROSS led with the largest increase.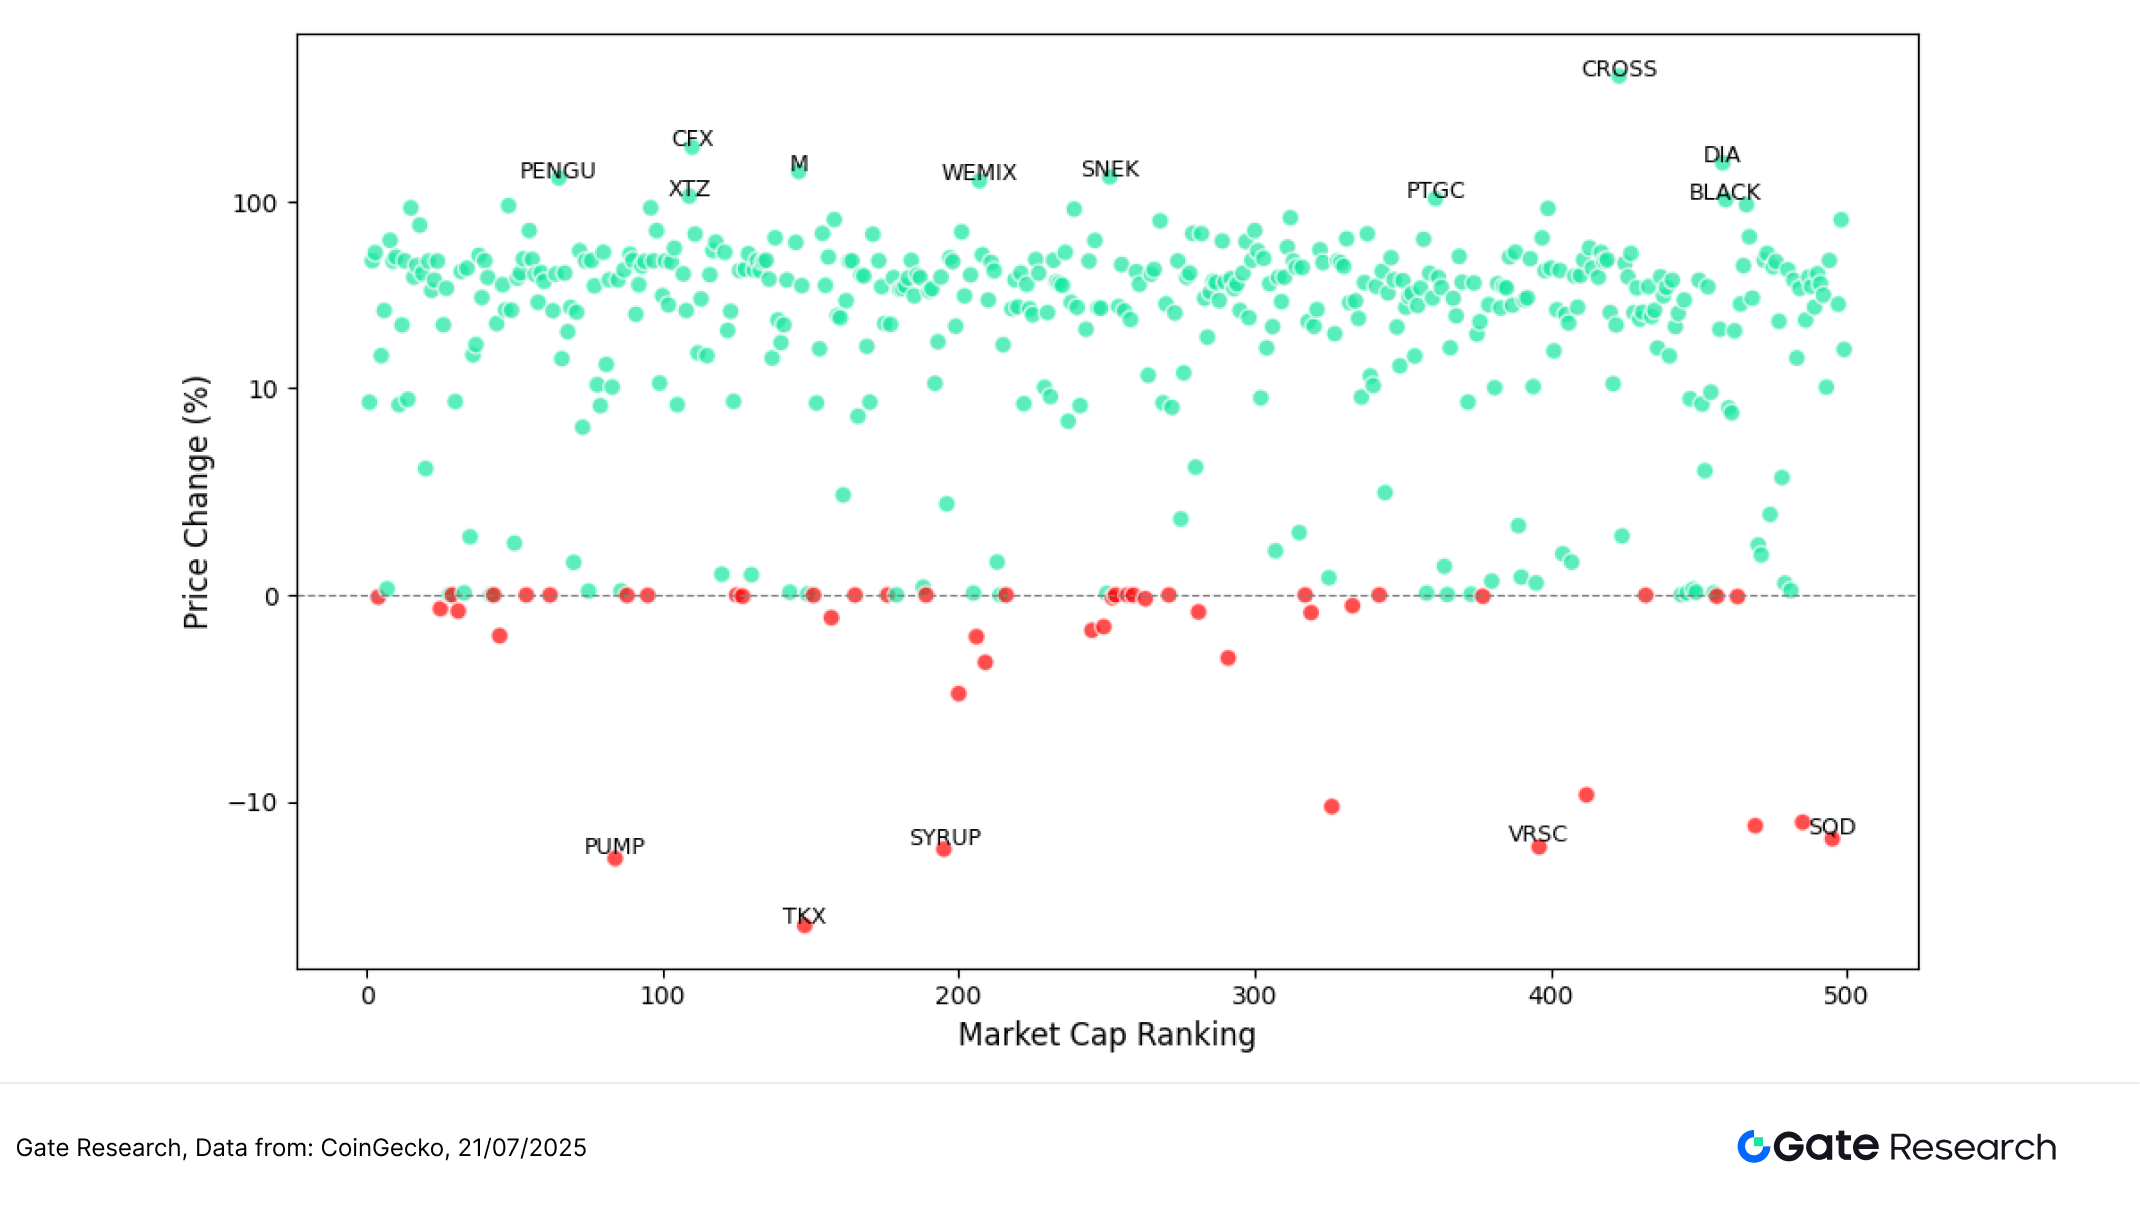
Top 100 Market Cap Leaders
During the recent consolidation phase, the top 100 tokens by market capitalization demonstrated relatively stable performance, with price changes showing narrower dispersion. This reflects a defensive allocation trend among investors favoring mainstream assets. Excluding stablecoins and LSD tokens, the top five gainers were: PENGU (+134.76%), ENA (+95.72%), CRV (+93.21%), XLM (+93.17%), and HBAR (+75.21%).
Most of these tokens benefited from strong thematic drivers, community momentum, or ecosystem catalysts—highlighting the market’s current preference for assets with compelling narratives and active engagement. PENGU, a meme token on Solana, continued to attract attention with sustained community hype. ENA and CRV rose on expectations related to stablecoin strategies and DeFi protocol upgrades, respectively. Meanwhile, XLM and HBAR gained traction through long-standing narratives focused on traditional payments and public chain alliances.
On the downside, a few top 100 tokens posted notable declines. The bottom five performers were: PUMP (-20.18%), PI (-1.97%), WBT (-0.78%), LEO (-0.66%), and FTN (+1.58%)—the weakest gainer despite a positive return. PUMP’s sharp drop likely stemmed from post-ICO profit-taking following early presale hype, serving as an example of structural correction. Others such as PI, WBT, and LEO showed sluggish trends due to the absence of new catalysts and declining market interest.
Overall, large-cap tokens exhibited resilience amid market turbulence, with capital leaning toward mainstream assets supported by strong narratives, ecosystem development, or active communities. The dominant strategy remains “selecting strength within stability.” The leading gainers were largely driven by thematic momentum and long-term growth potential, while early outperformers lacking fresh stories faced correction pressure. The market continues to reflect a structurally divergent pattern, with short-term trends likely favoring a defensive rotation.
Figure 4: Among the top 100 tokens, leading gainers were concentrated in narrative-driven and ecosystem-backed sectors. Capital tended to favor responsive mainstream assets, while previously hyped projects faced structural pullbacks.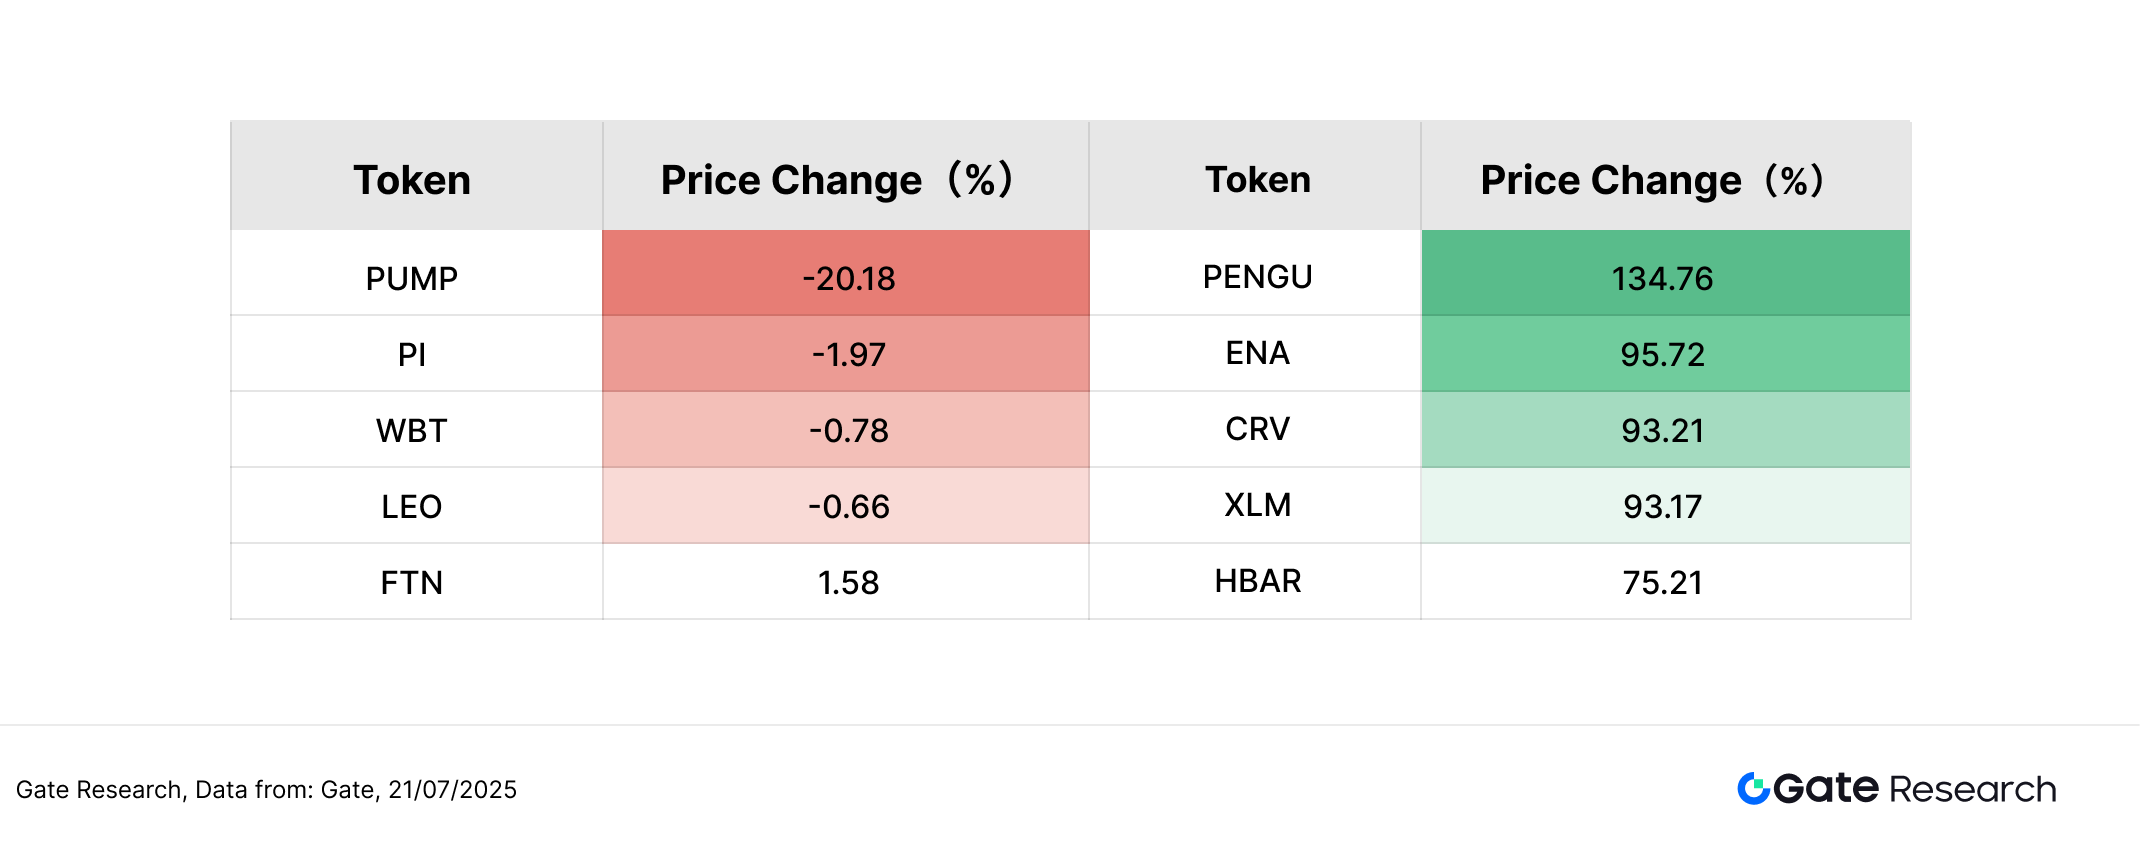
2. Volume Surge Analysis
Trading Volume Growth Analysis
Building on the analysis of token price performance, this article further examines the trading volume changes of selected tokens during the recent market rally. Using pre-rally volume as a baseline, we calculated the volume multiples as of July 21 to gauge shifts in market attention and trading activity.
Data shows that GAL recorded the most significant volume increase—up 47.49x—despite ranking low in market cap (467th). Its price rebounded by 27.25%, highlighting the high beta characteristics of small- and mid-cap tokens in capital-driven market moves. ETC saw a 36.56x surge in volume and a 48.37% price rebound. This strong performance likely correlates with the surging interest in the Ethereum ecosystem. According to SoSoValue, ETH spot ETFs recorded $2.18 billion in net inflows over the past week, with BlackRock’s ETHA ETF alone drawing $1.76 billion, marking an all-time high and signaling accelerating institutional allocation to ETH. 【3】Against this backdrop, ETC, as a historical fork of Ethereum, was not included in ETF portfolios but still benefited from heightened sentiment and investor search for high-volatility alternatives, making it a standout in this rally.
Additionally, TRX and OHM posted volume increases of 17.43x and 15.85x, respectively, but with limited price gains of 9.20% and 8.40%, indicating active trading without strong upward momentum—suggesting range-bound behavior in the short term. SUSHI stood out with a 12.46x increase in volume and a 67.63% price surge, reflecting renewed interest in DeFi protocols with established branding and liquidity depth.
Structurally, this wave of volume expansion spanned a broad range of tokens—including major layer-1s, DeFi, exchange tokens, and mid-cap projects—rather than being confined to a single narrative. While a spike in trading volume does not always lead to sustained price growth, it often signals rising market attention, making it a critical short-term indicator to monitor.
Figure 5: Tokens such as GAL, ETC, and SUSHI saw significant volume surges, with some experiencing parallel price rebounds—indicating that market capital is gravitating toward assets with both volatility and liquidity.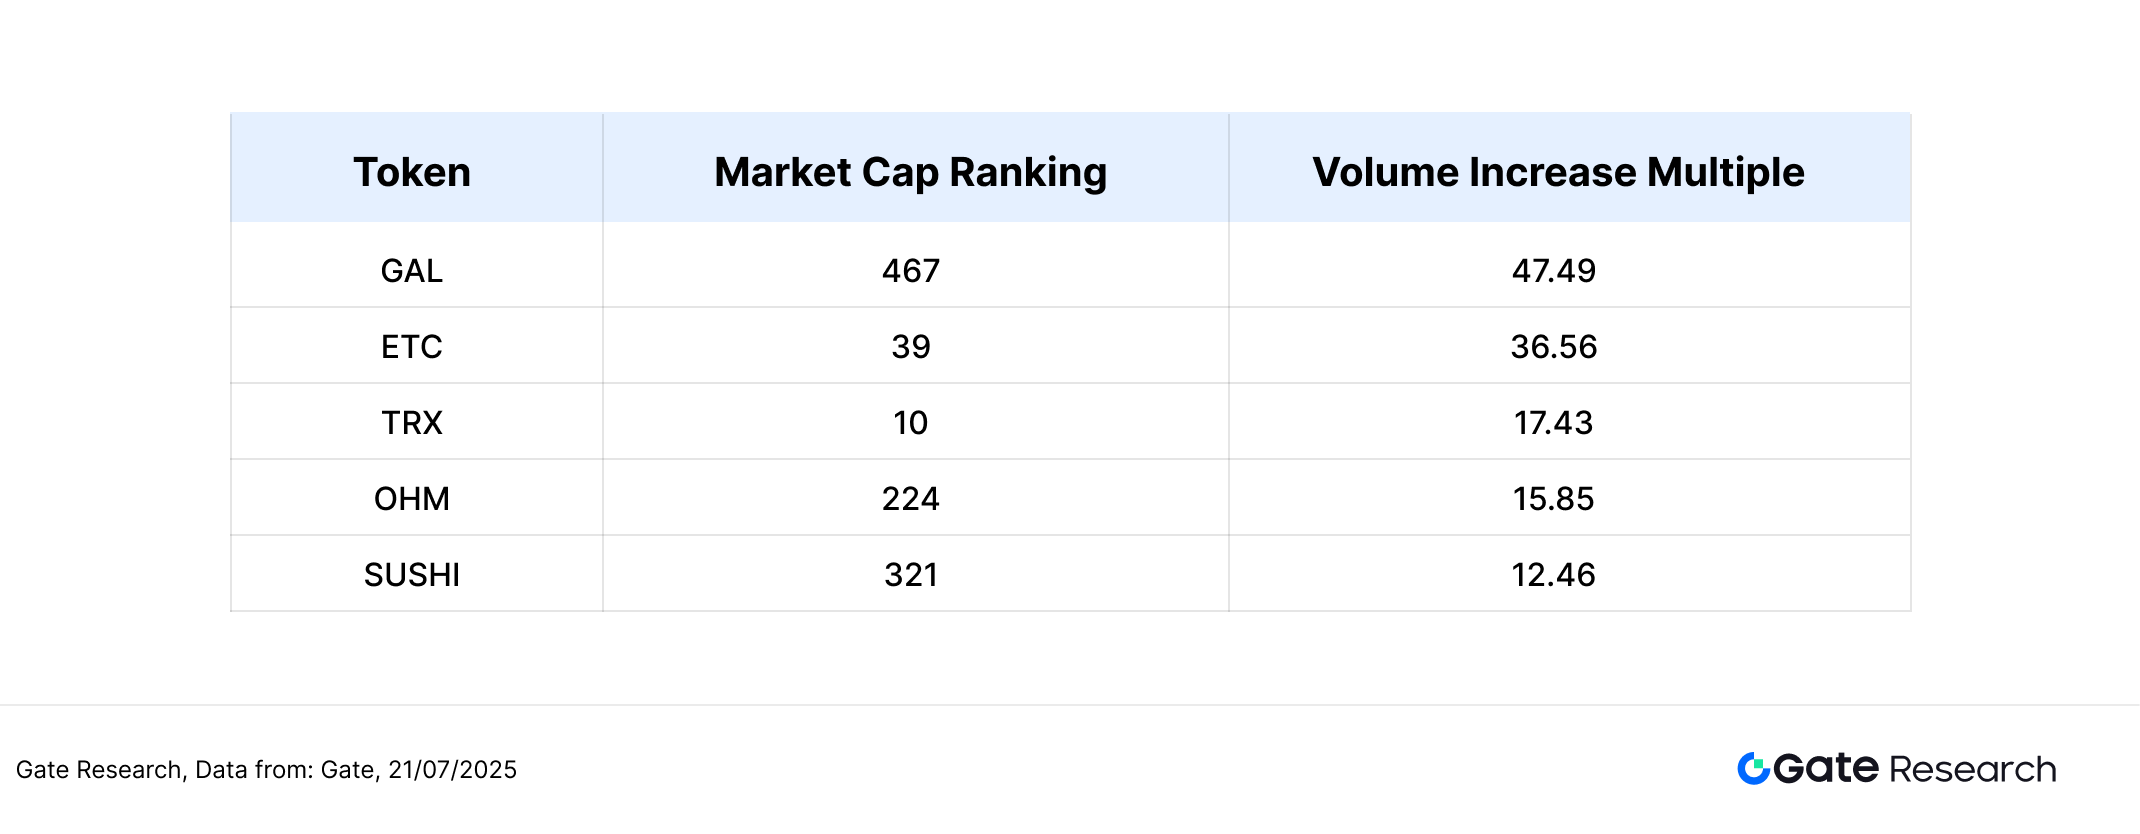
Volume-Price Relationship Analysis
Building on the previous analysis of volume surges, this section further incorporates price performance to plot a scatter diagram of Volume Increase Multiple (x-axis) versus Price Change % (y-axis). Both axes use a symmetrical log scale to better visualize extreme movements.
From the chart, the upper-right quadrant highlights tokens exhibiting clear “volume-price resonance” in this cycle—projects that saw both significant volume expansion and price appreciation. Notable examples include: SUSHI, with a 12.46x volume increase and 67.63% price gain, stood out amid renewed capital inflows into the DeFi sector. ETC (Ethereum Classic) saw its volume surge 36.56x and price rise 48.37%, benefiting from the spillover enthusiasm surrounding spot ETH ETFs and improved market sentiment. GAL, with a 47.49x increase in volume and a 27.25% price gain, was actively pursued by short-term speculative capital despite its smaller market cap. ETH staking derivatives such as OSETH and OETH also fall within this quadrant, reflecting rising demand amid the ETF narrative and increased interest in staking protocols.
The lower-right quadrant includes tokens with substantial volume growth but limited price appreciation, suggesting active trading without upward momentum—possibly due to resistance at higher levels or profit-taking pressure. Examples include: TRX and OHM, both with over 15x volume increases but price gains under 10%. RLUSD, Ripple’s newly launched stablecoin, experienced a notable volume surge but price remained stable near 0%, which aligns with its stable nature. The volume spike likely stemmed from liquidity provisioning and trading activity following a series of positive developments from Ripple—such as applying for a Luxembourg EMI license and gaining NYSE approval for an XRP ETF.
This round of market activity underscores volume-price resonance as a key signal for capital flows. Tokens in the upper-right quadrant like SUSHI, ETC, GAL, and ETH staking assets OSETH/OETH represent the most compelling volume-driven gainers, benefiting from clear narratives and strong liquidity support. Meanwhile, tokens like TRX and OHM show elevated activity without strong price moves, and RLUSD reflects structural volume growth tied to broader ecosystem developments rather than speculative trading.
Figure 6: Tokens such as SUSHI, ETC, and GAL sit in the upper-right quadrant, showcasing classic volume-price resonance and marking them as key targets of concentrated capital inflows in this rally.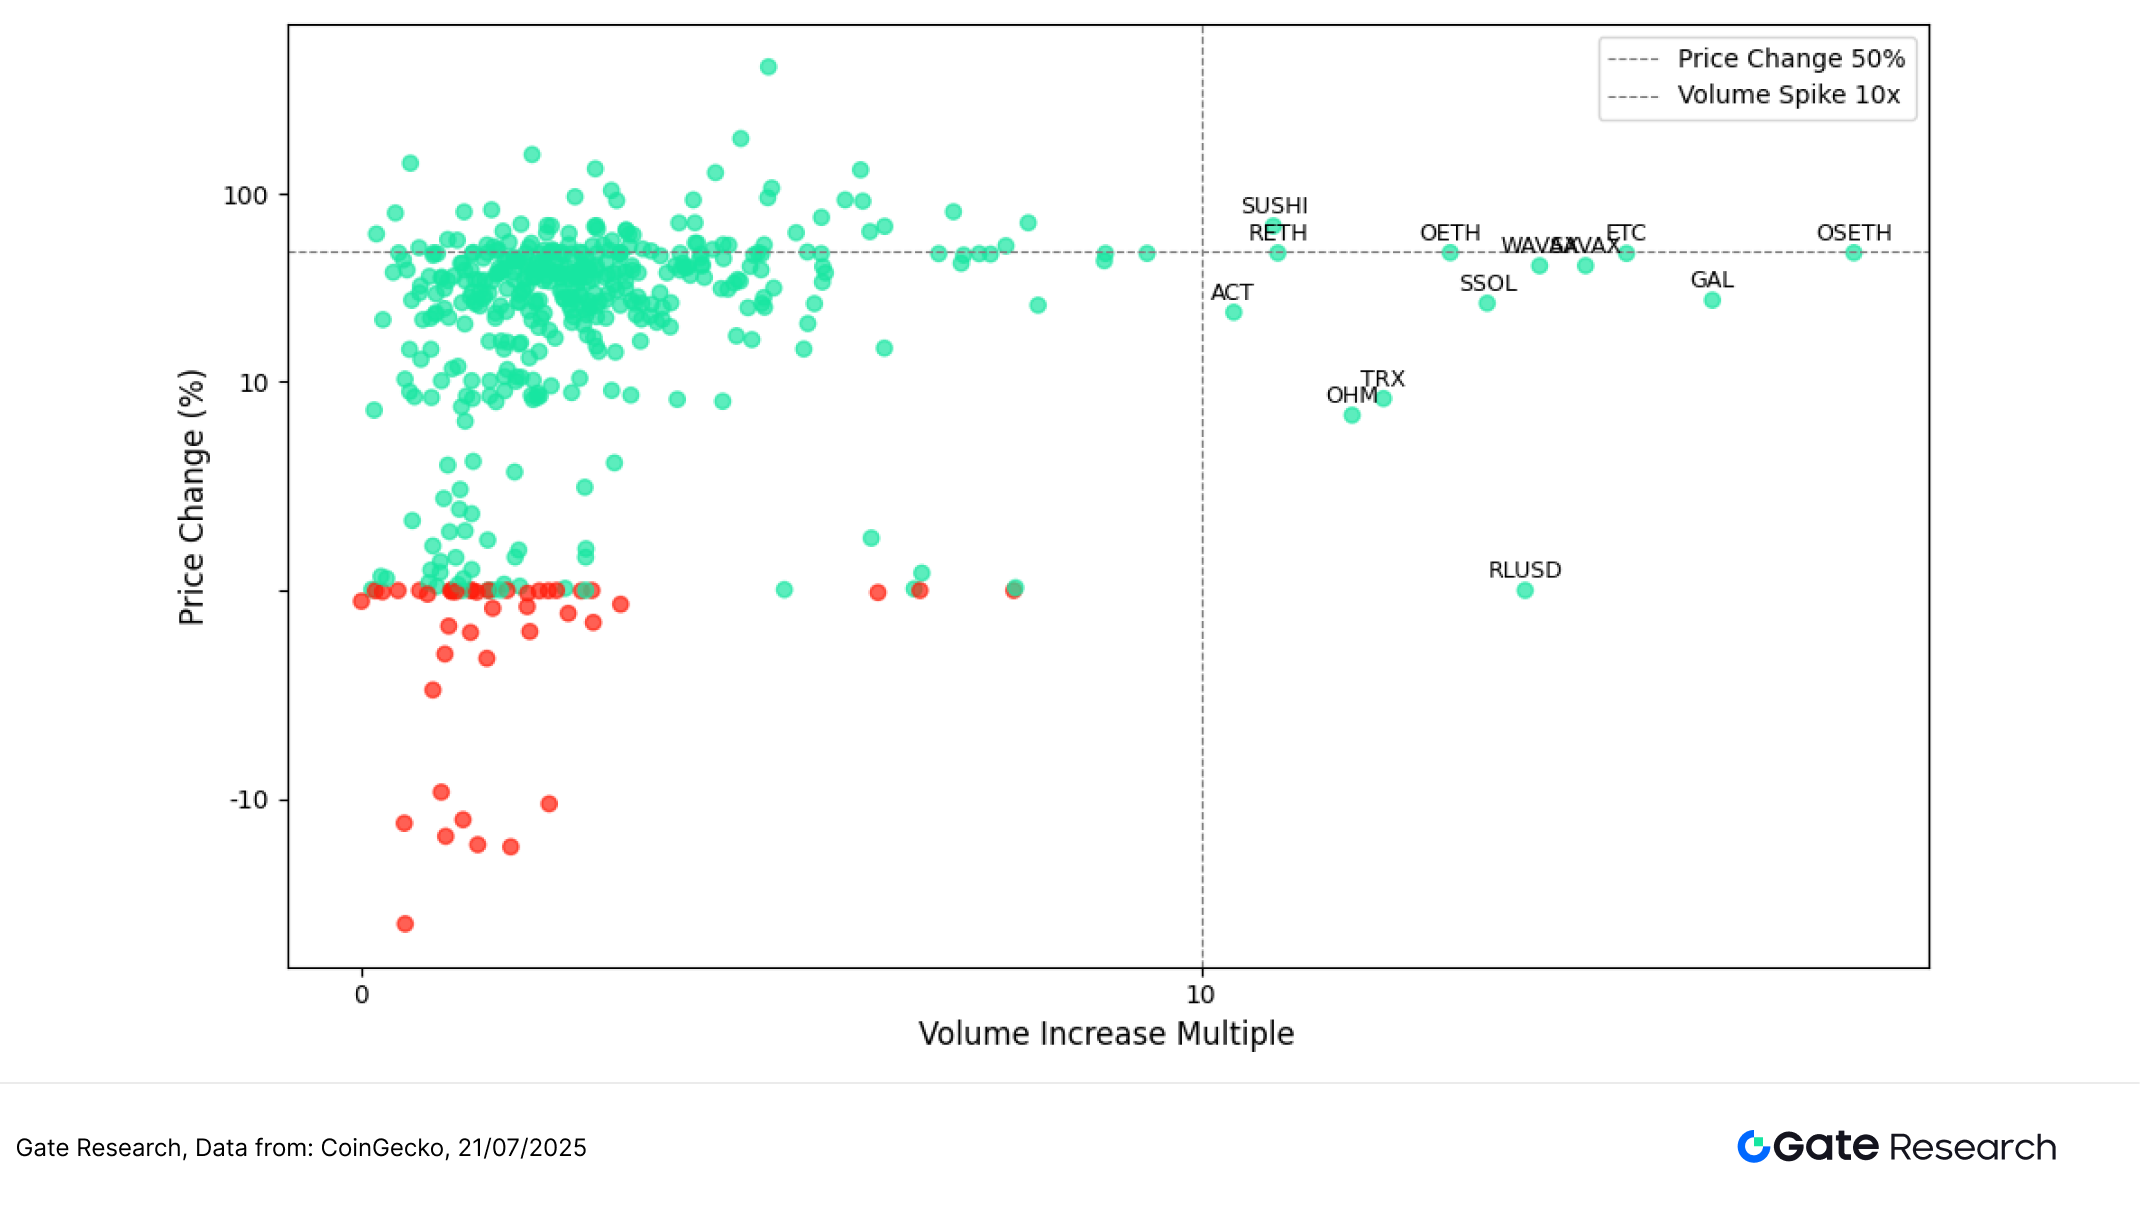
Correlation Analysis
Building on the previous discussion of the relationship between token trading volume and price performance, this section takes a statistical approach to analyze the structural linkage between the two. To assess whether market activity systematically influences price volatility, we introduce a relative activity indicator—Trading Volume / Market Cap—and calculate its correlation coefficient with price changes. This helps identify which tokens are more sensitive to capital flows and reveals the overall strength of volume-price coupling.
As shown in the chart, most tokens exhibit correlation coefficients between 0.75 and 0.95, indicating a generally positive relationship between trading activity and price movement. In the chart: Color represents the strength of the correlation (red = high, blue = low), Bubble size reflects token market cap, enabling visualization of volume-price patterns across different asset scales.
Tokens like DIA, CFX, and OM, located in the upper-left quadrant, show the strongest correlations, nearing or exceeding 0.95. These mid-to-small cap assets are highly reactive to volume changes, making them prime targets for short-term speculative capital. Their behavior reflects a high-elasticity volume-price coupling, where price movements are tightly linked to liquidity influxes.
On the other hand, tokens such as PROM, XCN, and ETC, shown on the right with larger bubble sizes, demonstrate relatively weaker correlations (around 0.75–0.80). Their larger market caps and broader participant bases lead to more stable price action, even with increased trading activity. These assets often serve as “liquidity anchors” in structural markets. Notably, ETC has the largest bubble, indicating both high volume and substantial capital involvement. As discussed earlier, ETC’s performance is closely tied to the spillover momentum from ETH spot ETF enthusiasm.
The correlation analysis reveals that most tokens show a significant volume-price relationship, especially mid-to-small caps like DIA, CFX, and OM, which are highly sensitive to trading activity. Meanwhile, large-cap tokens like ETC and SUSHI exhibit more stable, less elastic responses. Overall, the current market presents a “high elasticity in small caps, high stability in large caps” structure—highlighting distinct capital preferences and coupling characteristics across asset types.
Figure 7: Tokens such as DIA, CFX, and CKB display strong volume-price linkage and high sensitivity to capital movement; meanwhile, larger-cap tokens like ETC and SUSHI exhibit weaker correlation but offer greater trend stability.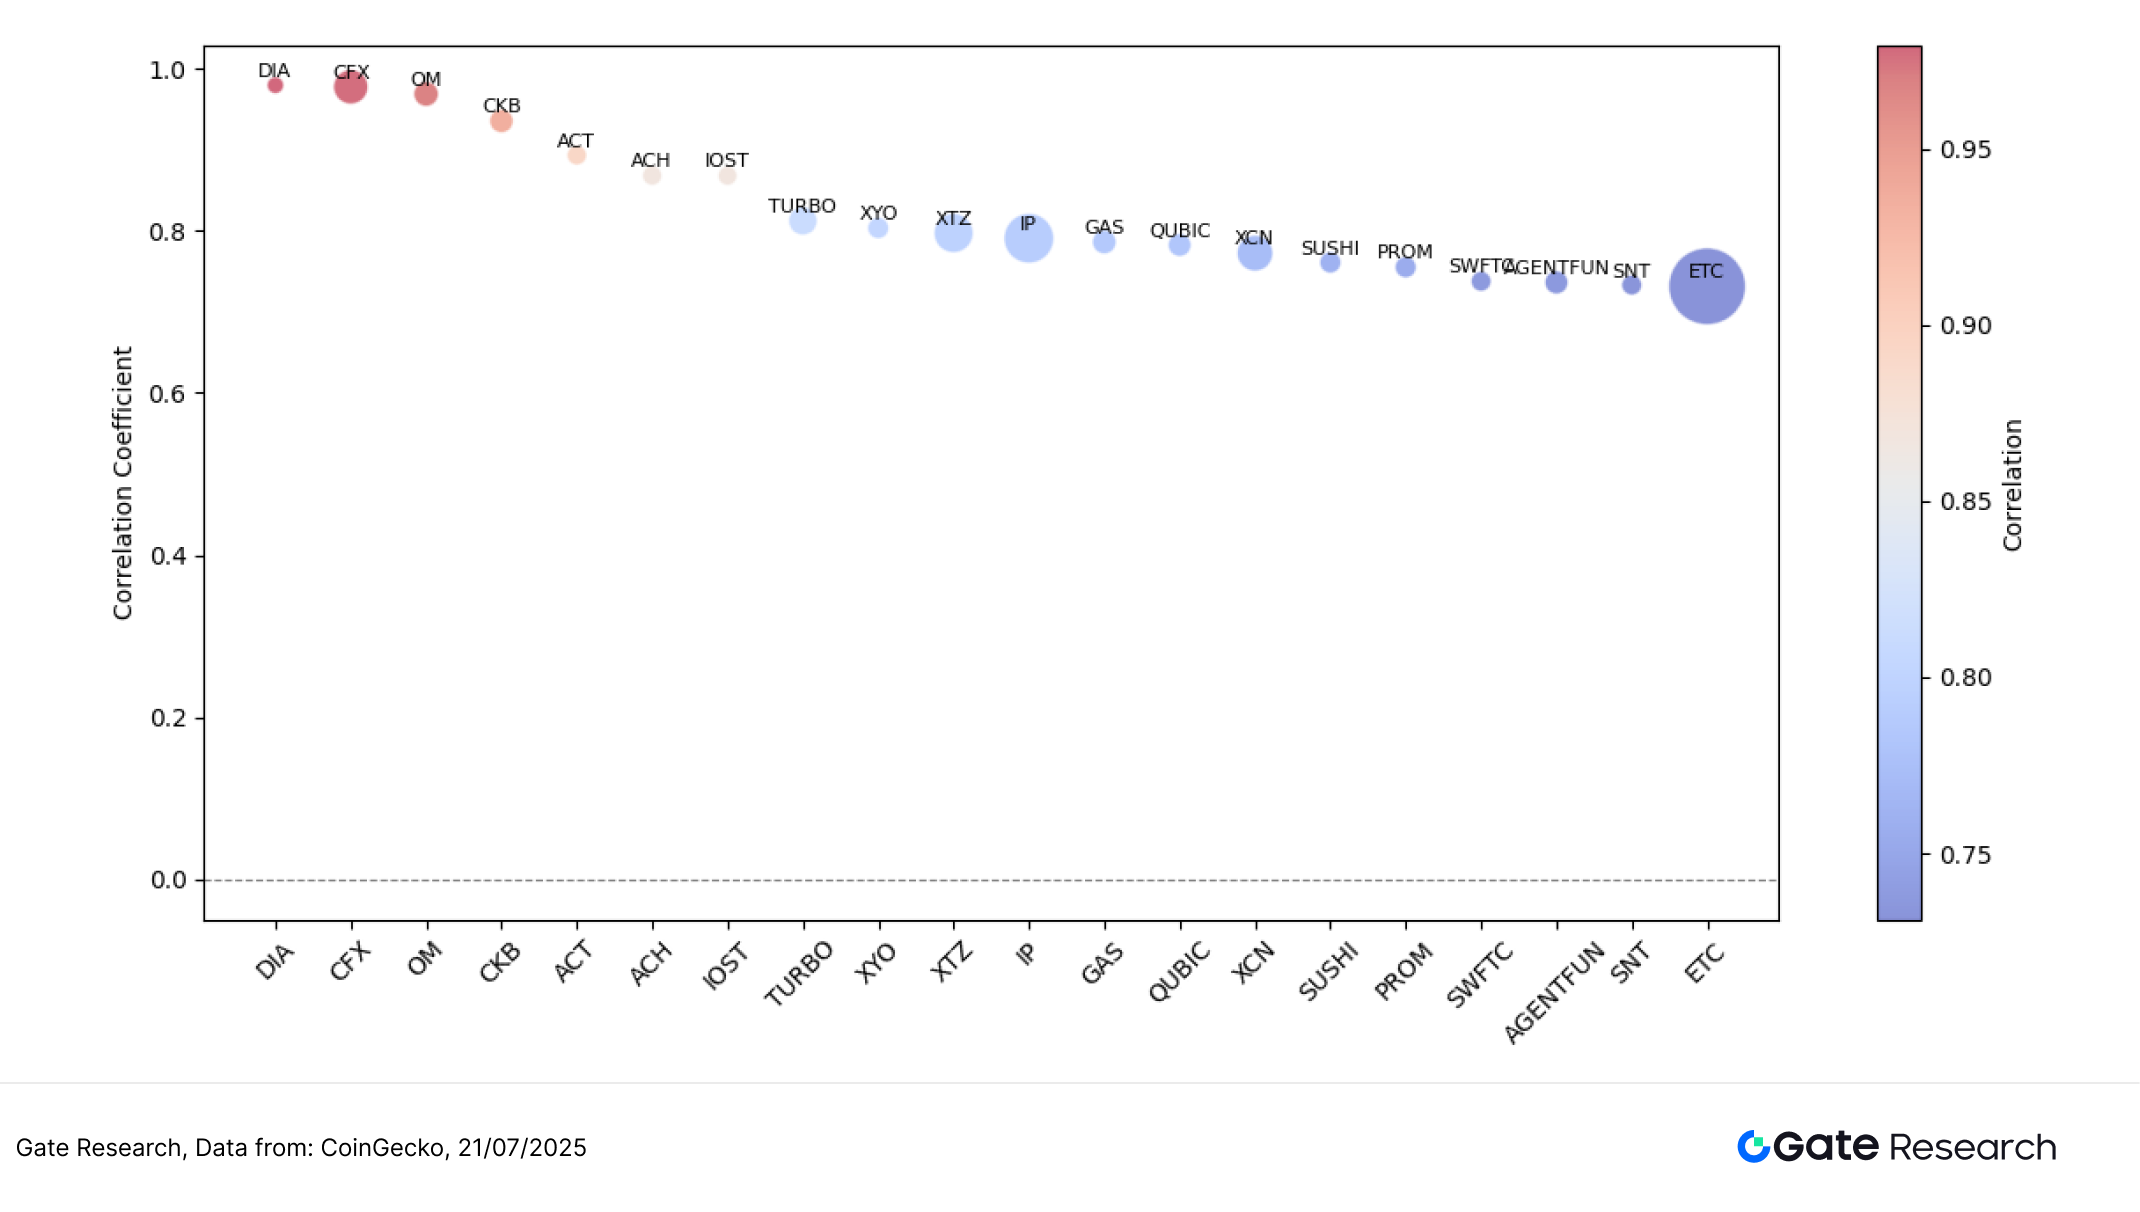
In summary, this round of crypto market activity has revealed an increasingly clear pattern of volume-price correlation, with trading activity playing a growing role in driving price movements. Mid- to small-cap assets such as DIA, CFX, and OM exhibit greater elasticity and short-term speculative value, as they tend to move in tandem with rising volumes. In contrast, larger-cap assets like ETC demonstrate more stable structural behavior, serving as liquidity anchors in a structurally segmented market. Overall, capital rotation remains focused on tokens characterized by high activity and strong narratives, and this structural divergence is expected to persist.
Beyond active trading performance, several potential airdrop campaigns are currently underway, spanning key sectors such as privacy-preserving computation, browser-based node networks, sports community incentives, and decentralized development platforms. Users who act promptly may be able to secure early exposure to upcoming tokens during this period of market consolidation. The following is a brief overview of notable airdrop tasks and participation methods.
Airdrop Highlights
This article summarizes the key airdrop opportunities worth tracking during the period from July 8 to July 21, 2025, highlighting several early-stage projects currently active in the ecosystem. These include Orochi Network (Web3 privacy computing and oracle infrastructure), Gradient Network (browser node-based rewards network), OneFootball Club (a community platform bridging sports and Web3), and Fleek (a decentralized web development platform). These platforms typically incentivize early participation through browser extensions, social engagement tasks, Galxe missions, or points-based reward systems. The earned points and achievements may later be converted into tokens or used as criteria for airdrop distribution. Users can accumulate participation credentials by registering accounts, linking wallets and social accounts, and completing network tasks.
The following sections will detail each project’s core positioning, recent campaign updates, and participation steps to help users strategically capture early-stage Web3 opportunities.
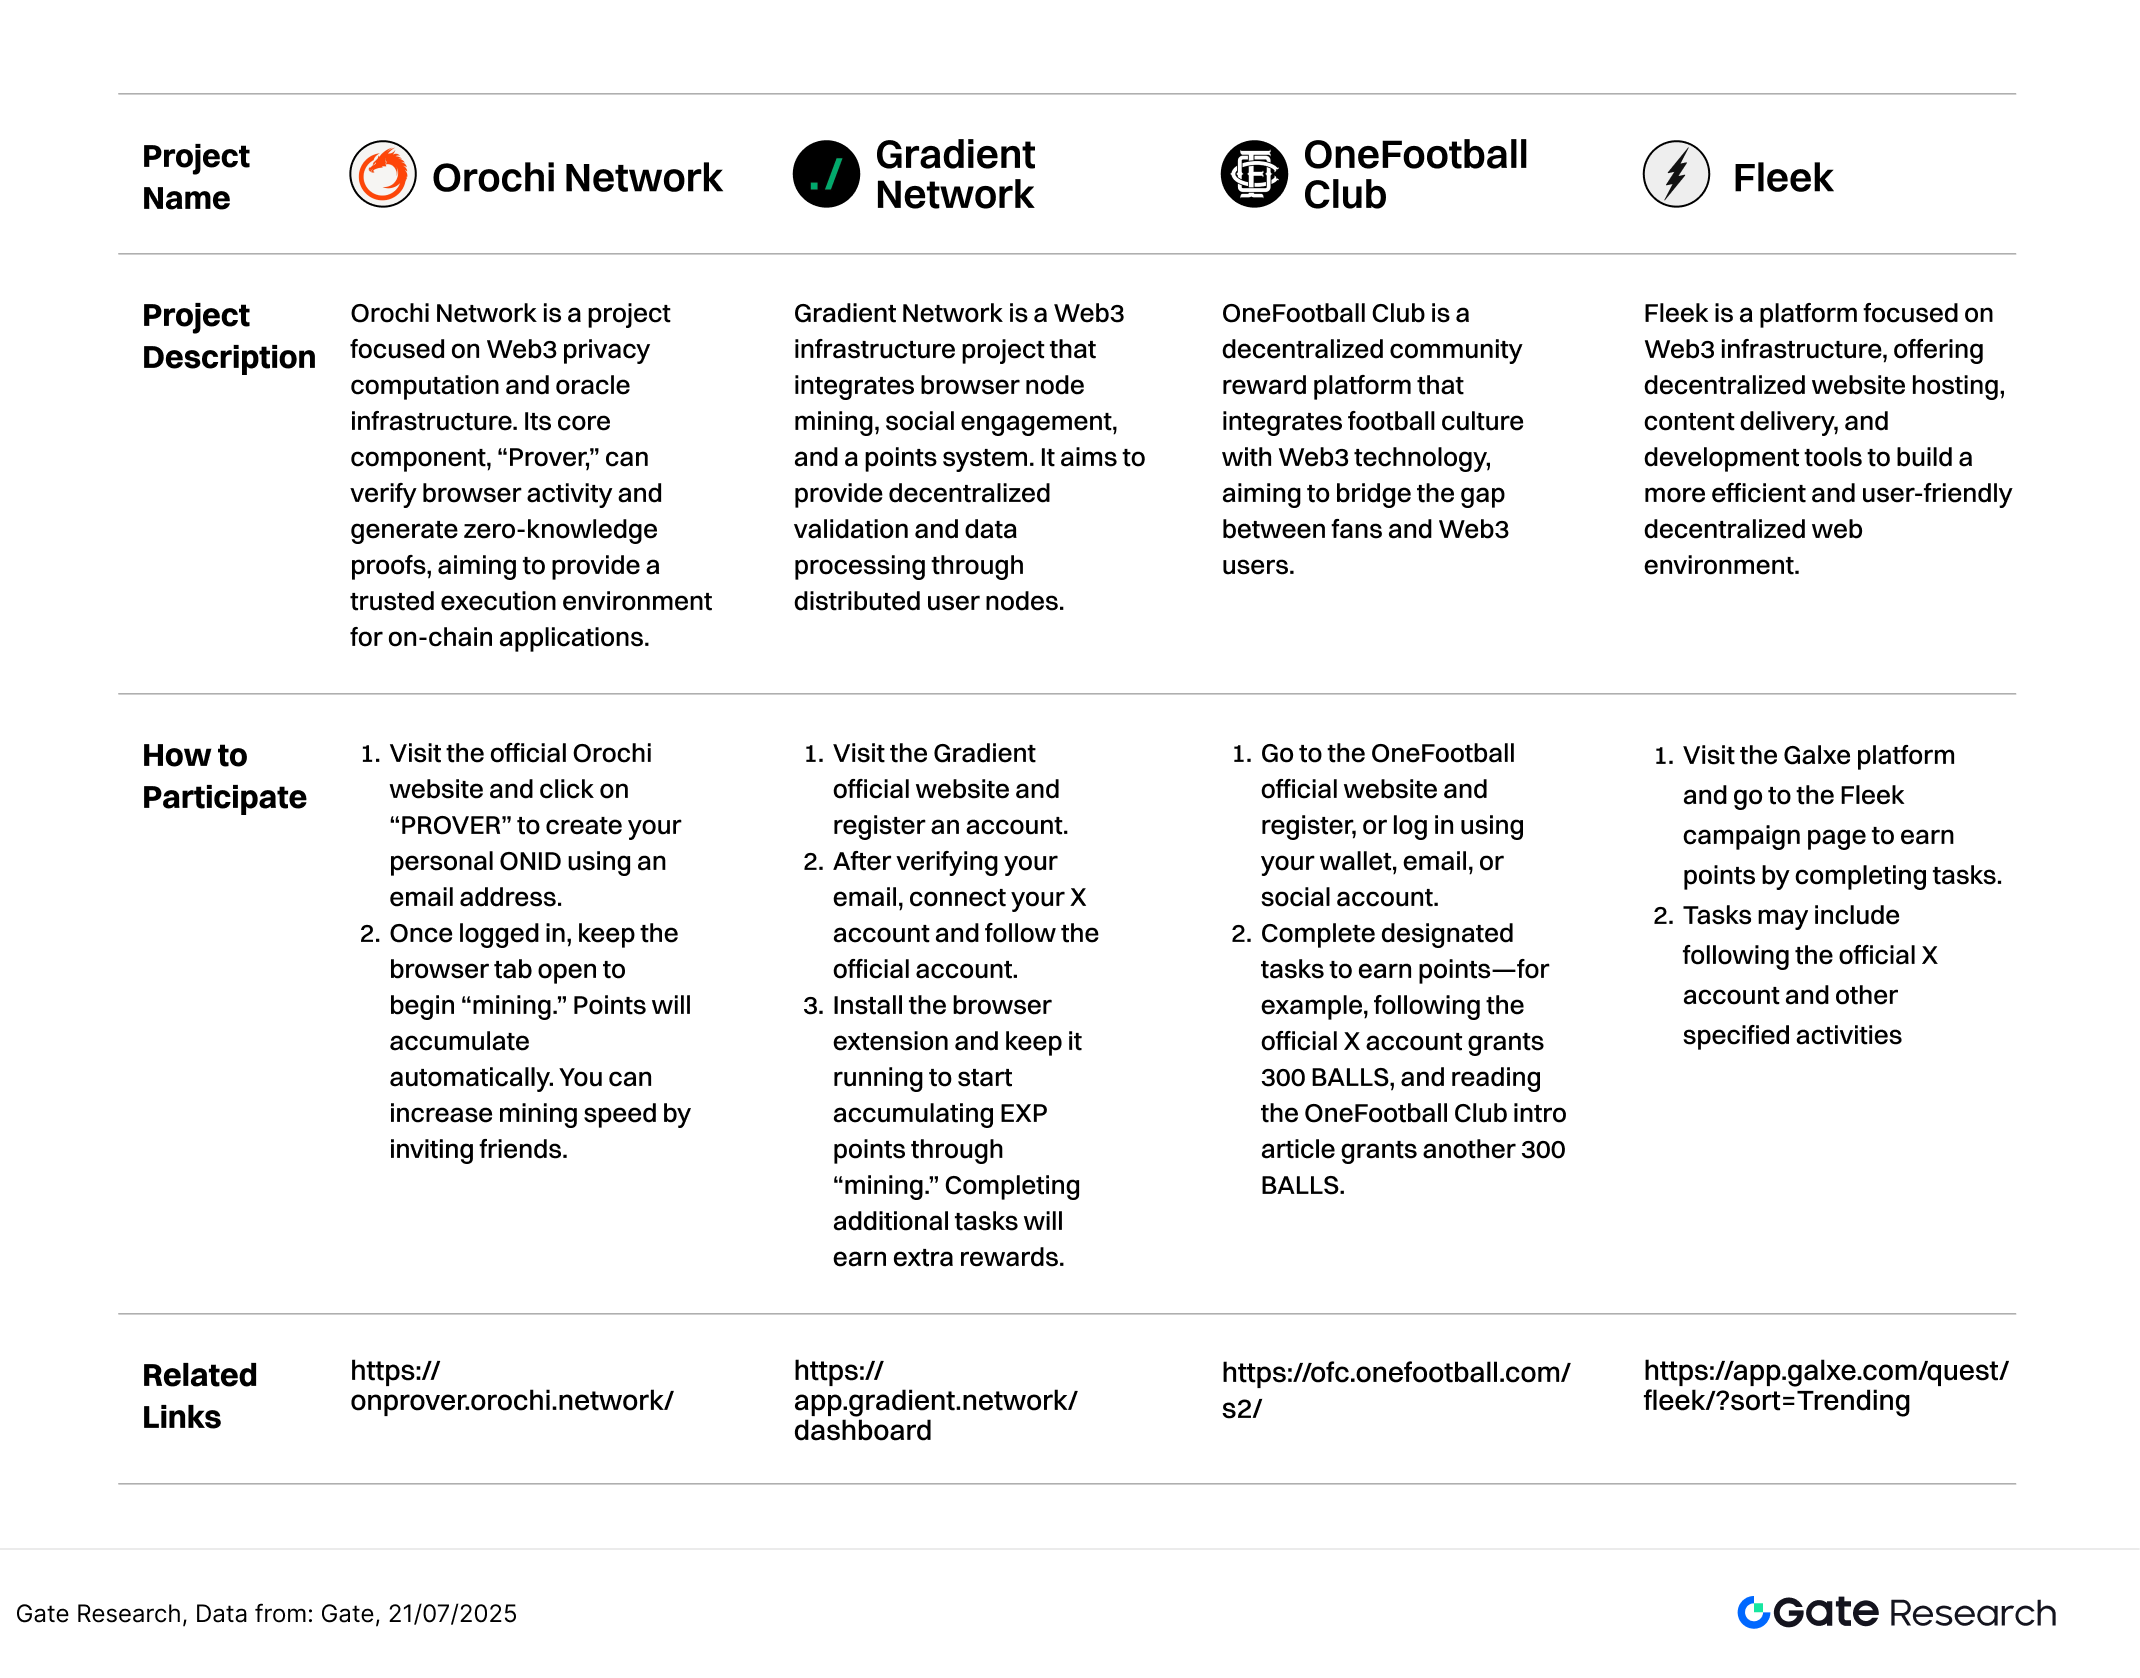
Orochi Network
Orochi Network is a project focused on Web3 privacy computing and oracle infrastructure. Its core component, Prover, verifies browser activity and generates zero-knowledge proofs, aiming to provide a trusted execution environment for on-chain applications【4】.
This campaign incentivizes users to participate in Prover testing by “mining” through a browser interface to earn the native token $ON, which may serve as a future airdrop credential.
How to participate:
- Visit the Orochi official website and click on “PROVER” to create your ONID using an email address.
- After logging in, keep the web page open to start “mining”; points will accumulate automatically. You can speed up mining by inviting friends.
Gradient Network
Gradient Network is a Web3 infrastructure project combining browser node mining, social behavior tracking, and a points system. It aims to provide decentralized verification and data processing through distributed user nodes. By installing a browser extension and staying online, users can earn EXP points, which may be redeemable for tokens or qualify for airdrops【5】.
Gradient recently completed a $10 million funding round and is currently running its Season 1 rewards program.
How to participate:
- Visit the Gradient official website and sign up for an account.
- Complete email registration, connect your X account, and follow the official profile.
- Install the browser extension and keep it running to start “mining” EXP points. Completing additional tasks grants bonus rewards.
OneFootball Club
OneFootball Club is a decentralized community incentive platform that merges sports culture with Web3 technology, aiming to bridge fans and Web3 users. The platform uses BALLS (S2) as its reward points. Users can earn points by completing social tasks, joining activities, and inviting others.
Supported by renowned football media outlet OneFootball, the platform boasts a strong user base and brand recognition. It also plans to issue a native token and is actively running Season 2, with points expected to be key to future airdrops.【6】
How to participate:
- Visit the OneFootball Club website and register via wallet, email, or social account.
- Complete official tasks to earn points—for example, following the official X account earns 300 BALLS, and reading the project intro article earns another 300 BALLS.
Fleek
Fleek is a platform focused on Web3 infrastructure, offering decentralized website hosting, content delivery, and developer tools to build a more efficient and user-friendly decentralized web. Fleek has launched a points rewards program, where users can earn points through specific tasks, product purchases, and promotional activities. These points will be used to distribute native tokens in the future【7】.
The current campaign is hosted on Galxe, and includes on-chain verifications, social engagement, and subscriptions—ideal for early users looking to get ahead.
How to participate:
- Go to the Fleek campaign page on Galxe and complete the listed tasks to earn points.
- Tasks may include following the official X account and other community engagements.
Reminder
Airdrop plans and participation methods are subject to change at any time. Therefore, it is recommended that users follow the official channels of the above projects for the latest updates. Additionally, users should exercise caution, be aware of the risks, and conduct thorough research before participating. Gate does not guarantee the distribution of subsequent airdrop rewards.
Conclusion
During the market cycle from July 8 to July 21, 2025, the crypto market exhibited increasingly clear signs of volume-price correlation, reflecting a dual structure of sector rotation and narrative-driven trends. Among the top 500 tokens by market cap, the gaming chain project CROSS led the gains with a remarkable +476%, while mid- to small-cap tokens like GAL and SUSHI experienced significant volume surges and price increases, becoming favorites among short-term traders. In contrast, large-cap assets such as ETC showed more stable price movements, serving as liquidity anchors.
Analyzing volume anomalies reveals that tokens like GAL, ETC, and SUSHI recorded more than 10x increases in trading volume, forming classic “volume-price resonance” patterns that drew market attention. In the volume-price distribution chart, assets in the upper-right quadrant exhibit clear capital inflows and price responses, indicating market preference for tokens with liquidity, narratives, and event-driven catalysts. For example, ETH staking-related assets OSETH and OETH also experienced synchronized volume and price increases, driven by the spot ETF boom and renewed interest in staking ecosystems.
Overall, market capital rotation remains centered on the theme of “high activity + strong narrative”, with volume changes continuing to serve as a key signal for identifying short-term trends and sector rotations. In this structurally segmented market phase, mid- to small-cap tokens demonstrate higher price elasticity and trading opportunities. If the market continues to benefit from policy tailwinds and capital inflows, the current rotation pattern is likely to persist, providing a foundation for medium-term momentum buildup.
In addition, this period’s featured airdrop opportunities—Orochi Network, Gradient Network, OneFootball Club, and Fleek—span popular sectors such as privacy computing, browser node networks, sports community engagement, and decentralized development platforms. These projects are mostly in testing or early incentive phases, with clearly defined tasks and simple participation steps. Users can accumulate points and qualify for future token rewards by registering accounts, linking social profiles, installing extensions, and completing tasks. Continued participation not only boosts the chance of earning token incentives but also offers early access to potential Web3 upside.
Reference:
- CoinGecko, https://www.coingecko.com/
- X, https://x.com/cross_protocol/status/1945041047010075097
- Sosovalue, https://sosovalue.com/assets/etf/Total_Crypto_ETH_ETF_Fund_Flow?page=usETH
- Orochi Network, https://onprover.orochi.network/
- Gradient Network, https://app.gradient.network/dashboard
- OneFootball Club, https://ofc.onefootball.com/s2/
- Galxe, https://app.galxe.com/quest/fleek/?sort=Trending
Gate Research is a comprehensive blockchain and cryptocurrency research platform that provides deep content for readers, including technical analysis, market insights, industry research, trend forecasting, and macroeconomic policy analysis.
Disclaimer
Investing in cryptocurrency markets involves high risk. Users are advised to conduct their own research and fully understand the nature of the assets and products before making any investment decisions. Gate is not responsible for any losses or damages arising from such decisions.
Related articles

12 Best Sites to Hunt Crypto Airdrops in 2025

Top 20 Crypto Airdrops in 2025

Gate Research: BTC Breaks $100K Milestone, November Crypto Trading Volume Exceeds $10 Trillion For First Time

Gate Research: 2024 Cryptocurrency Market Review and 2025 Trend Forecast

A Must-Try Project Backed by Binance Labs with Extra Staking Rewards (Step-by-Step Guide Included)
